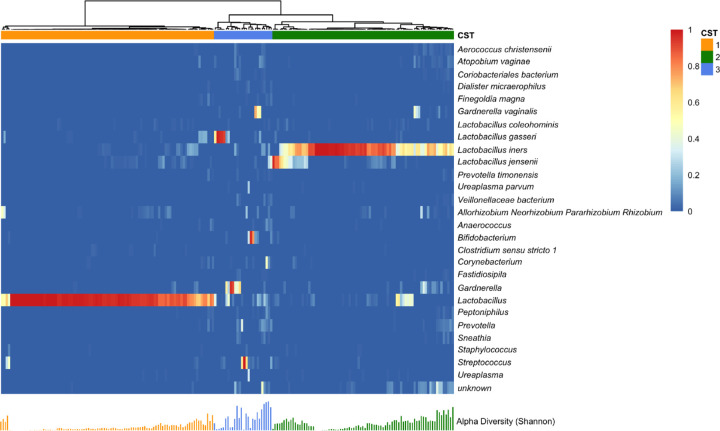
Figure 1. Vaginal Microbiome Profile by Community State Type.
Heatmap represents relative abundance of vaginal bacterial taxa (row) in sample (column). Hierarchical clustering with Ward’s linkage clustered samples into three distinct vaginal bacterial compositions called community state type (CST). Each bar under the heatmap indicates Shannon’s index of the corresponding sample.

