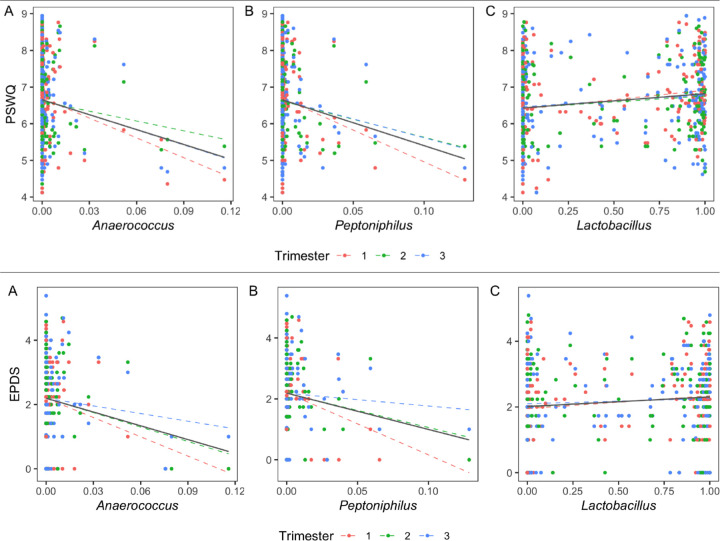
Figure 3. Correlation Between Bacterial Taxa and PSWQ/EPDS.
Scatter plots show the association between PSWQ/EPDS scores and the relative abundance of taxa at q = 0.05. Each dotted color line represents a linear relation between PSWQ/EPDS and each taxon at each trimester. The solid black line represents an overall linear relation between PSWQ/EPDS and each taxon across trimesters.

