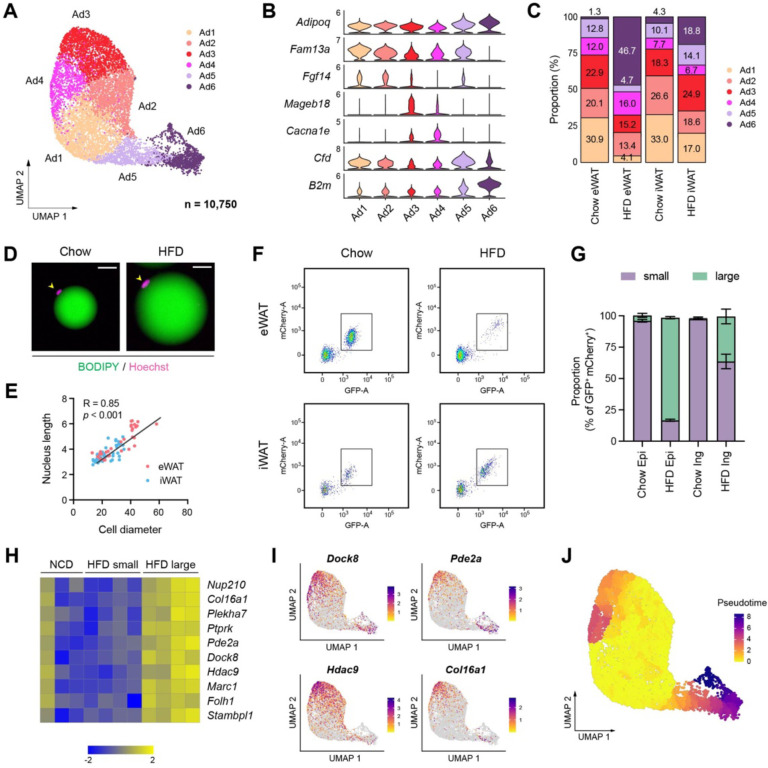
Figure 4. Distinct functional and cellular states of adipocytes affected by obesity.
(A-C) Identification of adipocyte subpopulations. (A) UMAP projection, (B) marker genes, and (C) the relative proportions of adipocyte subpopulations (n = 10,750). (D) Immunofluorescence microscopy images of BODIPY- and Hoechst-stained adipocytes isolated from eWAT in chow- and HFD-fed mice. Scale bars: 20 μm. (E) Scatterplot illustrating the correlation between adipocyte size, measured by diameter, and nucleus size, measure by length, in eWAT (red) and iWAT (blue). (F) Scatterplot illustrating the size distribution of mCherry- and GFP-labeled adipocyte nuclei from NuTRAP mice across different fat depots and diets. (G) The relative proportions of small and large nuclei within mCherry- and GFP-labeled adipocyte nuclei across different fat depots and diets. Data are presented as mean ± SEM (n=4) See Supplementary Fig 6D for gating criteria. (H) Heatmap showing Z-scored expression of hypertrophy signature genes in iWAT adipocyte nuclei from chow-fed mice and in small and large adipocyte nuclei from HFD-fed mice. The signature genes were identified based on enrichment in large versus small adipocyte nuclei in HFD-fed mice. (I) UMAP visualization of select hypertrophy signature genes in adipocytes. (J) Representation of pseudotime within adipocytes, as identified by Monocle3.

