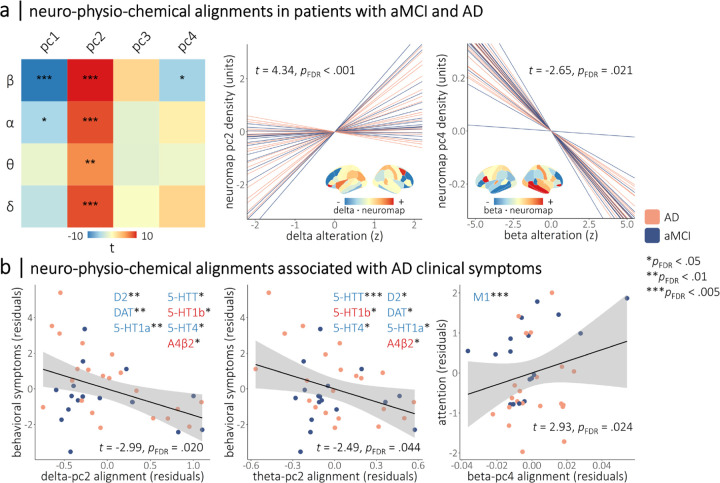
Figure 2. Neurophysiological alterations in patients with aMCI and AD align to neurochemical systems with relevance for clinical symptoms.
The heatmap in (a) indicates the strength of the alignments between band-limited alterations in rhythmic neurophysiology (y-axis) and the normative neurochemical gradients (x-axis) from Figure 1. Colors indicate the t-values of these relationships, with asterisks indicating statistical significance after correcting for multiple comparisons. Line plots in (a) show the participant-level simple slopes representing two of these alignments, with the remaining alignments displayed in Figure S2. Overlaid cortical maps indicate the dot product of the relevant neurophysiological alterations and neurochemical gradient densities per region, with warm and cool colors indicating positive and negative agreement, respectively, between the two measures. Representative topographies of delta rhythmic alterations from patients with high and low alignment to the second neurochemical gradient are shown in Figure S3. Scatterplots in (b) indicate the moderations of neurochemical-neurophysiological alignments from (a) by cross-sectional clinical symptom severity, with the strength of alignment shown on the x-axis and the clinical symptom score shown on the y-axis. Inlaid neurotransmitter receptor/transporter abbreviations indicate the respective atlases that replicate the relevant moderation effect in post-hoc testing, with the color and saturation of each label indicating the sign of the corresponding loading onto the neurochemical gradient. For all plots, the color of the lines/points indicates whether patients were in the amnestic mild cognitive impairment or probable Alzheimer’s disease clinical subgroup. ***pFDR < .005, **pFDR < .01, *pFDR < .05.

