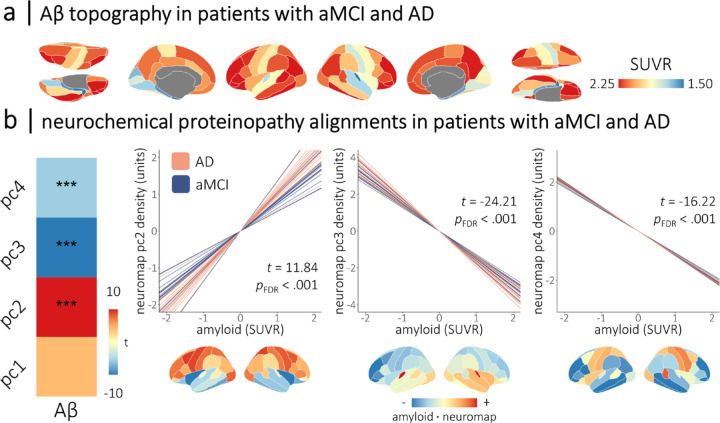
Figure 3. Cortical deposition of amyloid-β in patients with aMCI and AD aligns with neurochemical systems.
Cortical maps in (a) show the mean topography of amyloid-β deposition (in standardized uptake value ratios; derived from 18F florbetapir positron emission tomography) across patients with aMCI and AD from the DMAP cohort. The heatmap in (b) indicates the strength of the alignments between cortical deposition of amyloid-β (x-axis) and the normative neurochemical gradients (y-axis) in these patients. Colors indicate the t-values of these relationships, with asterisks indicating statistical significance after correcting for multiple comparisons. Line plots in (b) show the participant-level simple slopes representing the alignments from (a), with line color indicating whether patients were in the amnestic mild cognitive impairment or probable Alzheimer’s disease clinical subgroup. Cortical maps below are the dot product of the amyloid-β values and neurochemical gradient densities per region, with warm and cool colors indicating positive and negative agreement, respectively, between the two measures. Representative topographies of amyloid-β deposition from patients with high and low alignment to the fourth neurochemical gradient are shown in Figure S4. ***pFDR < .005.

