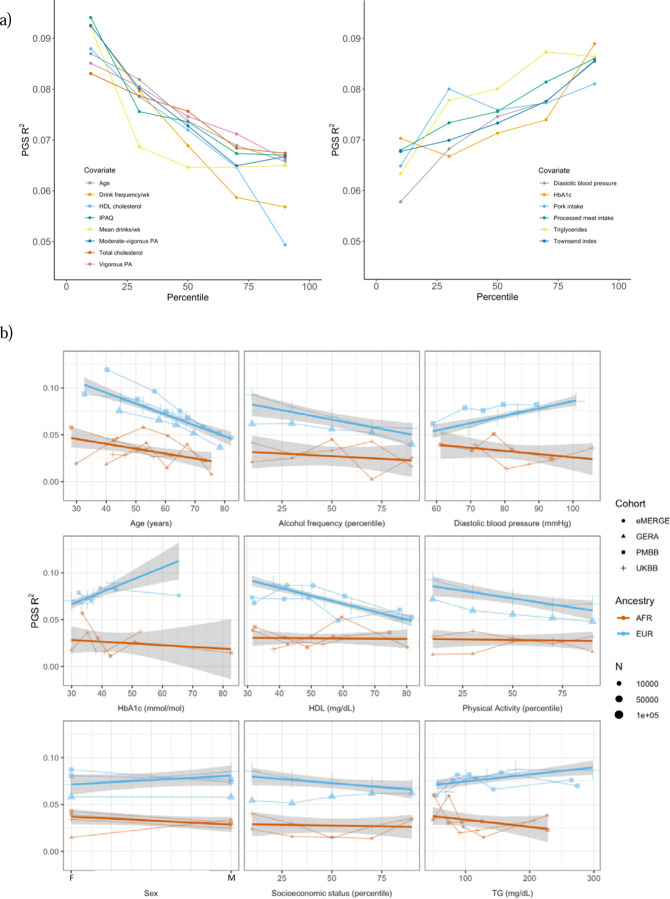
Figure 2.
PGS R2 stratified by quintiles for quantitative variables and by binary variables. a) Continuous covariates with significant (p < 8.1x10⁻⁴) R2 differences across quintiles in UKBB EUR. Pork and processed meat consumption per week were excluded from this plot in favor of pork and processed meat intake. b) Covariates with significant differences that were available in multiple cohorts. When traits had the same or directly comparable units between cohorts we show the actual trait values (and show percentiles for physical activity, alcohol intake frequency, and socioeconomic status, which had slightly differing phenotype definitions across cohorts) plotted on x-axis. Townsend index and income were used as variables for socioeconomic status UKBB and GERA, respectively. Note that the sign for Townsend index was reversed, since increasing Townsend index is lower socioeconomic status, while increasing income is higher socioeconomic status. Abbreviations: physical activity (PA), International Physical Activity Questionnaire (IPAQ).

