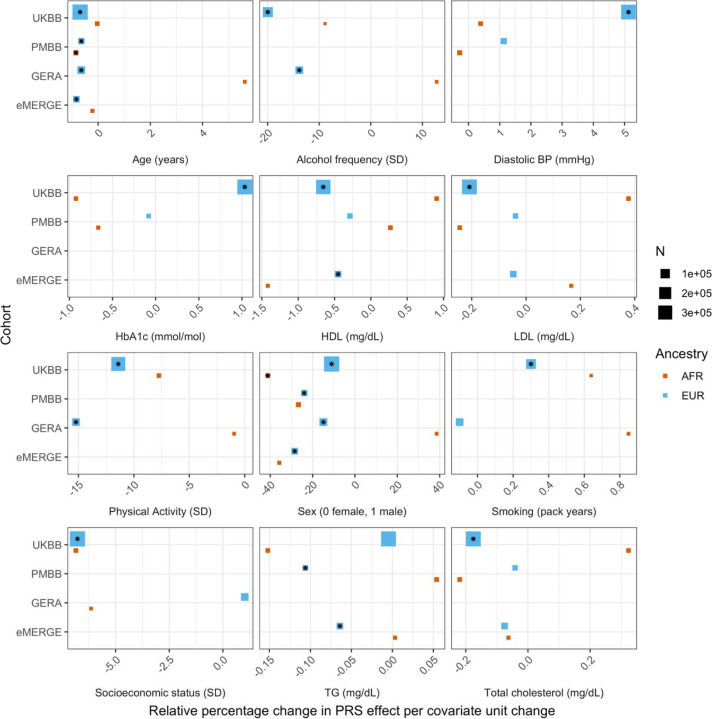
Figure 3.
Relative percentage changes in PGS effect per unit change in covariate, for covariates that significantly changed PGS effect (i.e., significant interaction beta at Bonferroni p < 8.1x10⁻⁴ – denoted by asterisks) and were present in multiple cohorts and ancestries. Same covariate groupings and transformations were performed as in Figure 1. Similarly, actual values were used when variables had comparable units across cohorts, and standard deviations (SD) used otherwise.

