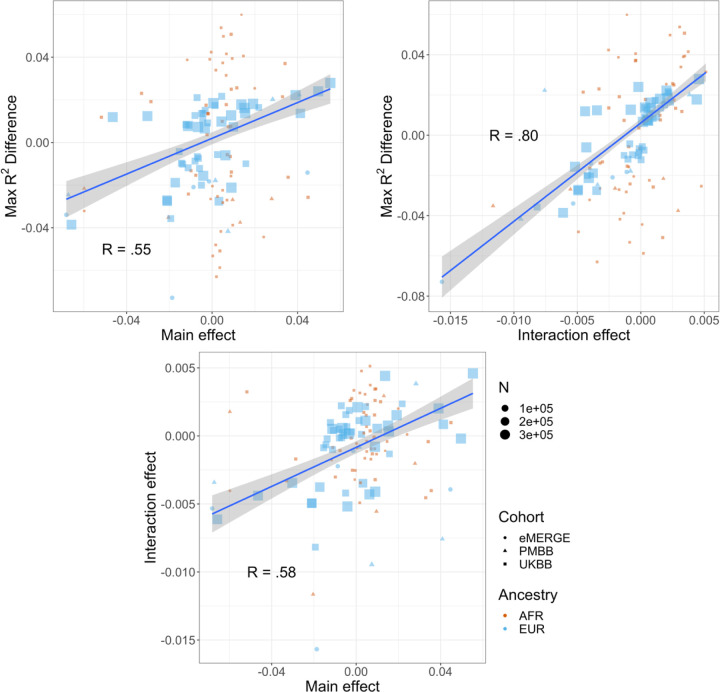
Figure 4.
Relationships (Pearson correlations weighted by sample size) between maximum R2 differences across strata, main effects of covariate on log(BMI), and PGS-covariate interaction effects on log(BMI). Main effect units are in standard deviations, interaction effect units are in PGS standard deviations multiplied by covariate standard deviations. Only continuous variables are plotted and modeled. GERA was excluded due to slightly different phenotype definitions.

