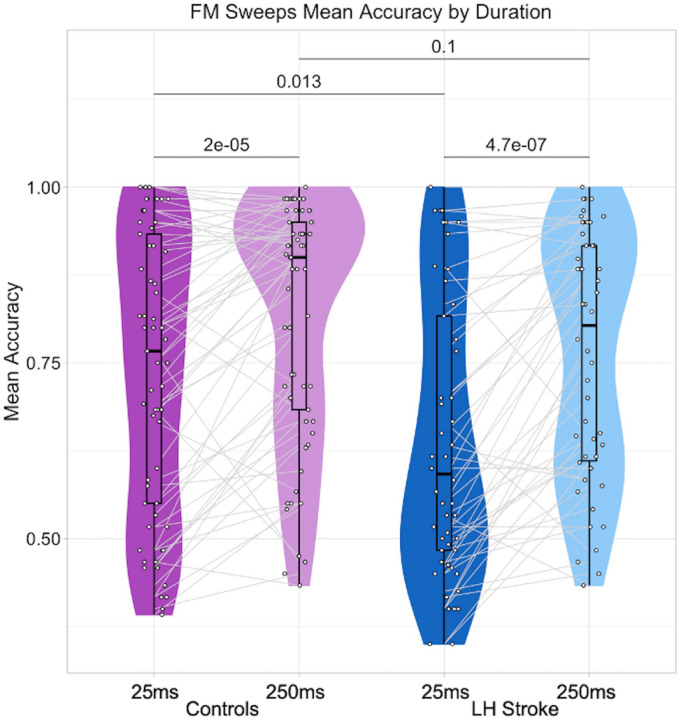
Figure 1. FM sweeps mean accuracy by duration.
The average accuracies on responses across trials for the short sweeps (25ms) and long sweeps (250ms) are shown for control participants (dark and light purple, respectively) and LHS participants (dark and light blue, respectively). White dots denote individual participants, and gray lines connect the same individual’s average performance on the short sweeps and the long sweeps. Each embedded boxplot has a bold black line designating the mean accuracy for each duration and participant group. Black lines above the data distributions are labeled with the p-values from two-tailed t-tests (paired t-tests for within-group duration differences, two-sample t-tests for between-group differences for each duration). See Table 2 for descriptive statistics and Table 3 for two-way repeated measures ANCOVA results including hearing as a covariate.

