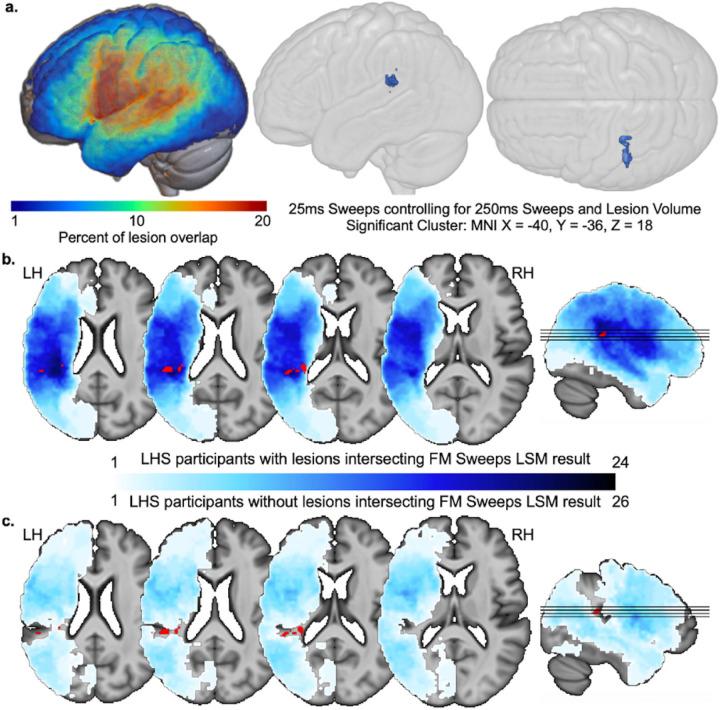
Figure 2. FM sweeps lesion-symptom mapping and creation of PT lesion subgroups.
(a) Lesion overlap maps are shown on the left for the 50 stroke participants included in the FM sweeps investigation. On the right, 3D-rendered template brains show the lateral and superior views of where lesions related to lower FM sweeps mean accuracy on 25ms trials, covarying for lesion size as well as mean accuracy on the 250ms trials. The center of mass for the cluster surviving CFWER correction is localized to MNI x= −40, y= −36, z= 18 (planum temporale). (b) Lesion overlap is shown in blue (greater overlap in darker blue) on select axial and sagittal slices for n=24 LHS participants with lesions that overlap with the FM sweeps LSM result (highlighted in red; same as result in a. (c) Lesion overlap is shown in the same color scale as b for n=26 LHS participants with lesions that do not overlap with the FM sweeps LSM result.

