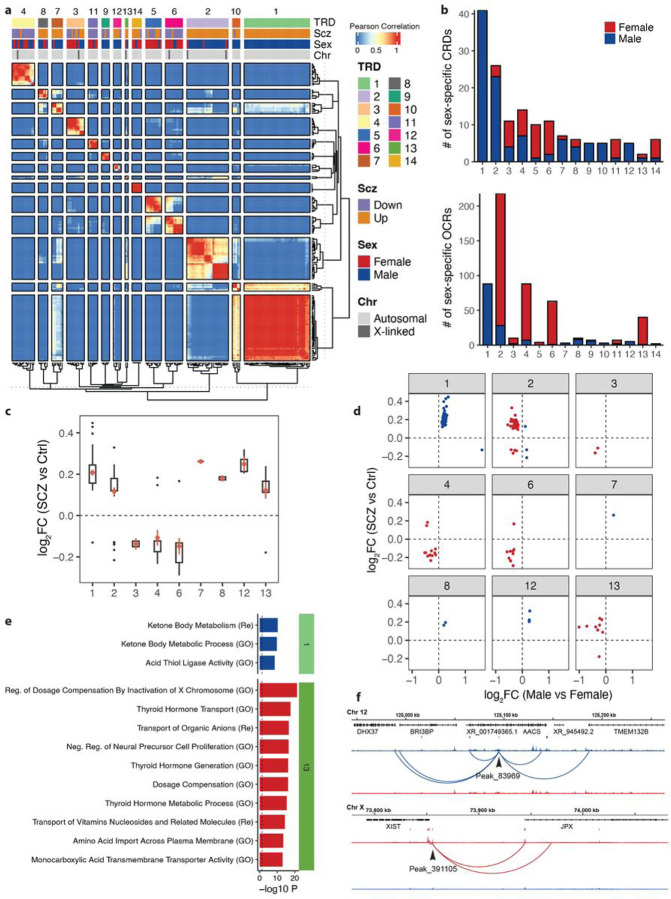
Figure 5. Sex-specific trans-regulatory domains.
a) Heatmap depicting hierarchical clustering of trans interactions of 155 CRDs that exhibit differential accessibility between males and females in neurons. The layers above the heatmap show: TRD, clustering results in 14 TRDs using gamma statistics; SCZ, upregulation and downregulation of SCZ neuronal CRDs; Sex, female-specific (red) and male-specific (blue) neuronal CRDs; Chr, autosomal (light gray) and X-linked (dark gray) neuronal CRDs. b) Bar plots of the number of neuronal sex-specific CRDs per TRD (upper panel) and the number of neuronal sex-specific OCRs per TRD (lower panel). c) Boxplot of log2FC (SCZ cases vs controls) of neuronal sex-specific OCRs per TRD (TRD5, 9, 10, and 14 are excluded due to lack of sex-specific OCRs (female- and male-specific) within each TRD). d) Dot plots of log2FC (males vs females) on the x-axis compared to log2FC (SCZ cases vs controls) on the y-axis for neuronal sex-specific OCRs per TRD. Female-specific OCRs are in red and male-specific OCRs are in blue. e) Functional pathway enrichment of OCRs from neuronal TRD1 and TRD2 that overlap with SCZ-specific OCRs. All enrichments are significant at BH-corrected P-value of 0.05. GO: Gene Ontology, Re: Reactome. f) Examples of gene regulatory landscapes for OCRs that show differential chromatin accessibility based on sex (male/female) and SCZ (case/control) status. The upper example illustrates a male-specific OCR in the TRD1 region, while the lower example features a female-specific OCR from the TRD2 region.

