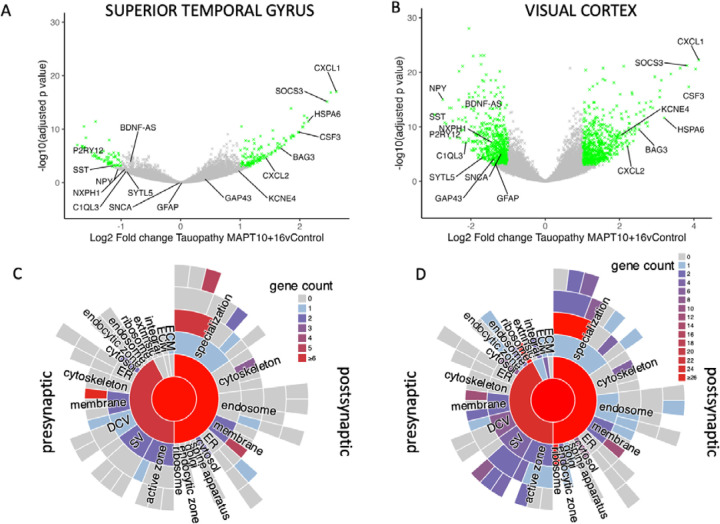
Figure 1: Changes in gene expression in FTDtau.
Volcano plots of RNAseq data show changes in gene expression in FTDtau in both superior temporal gyrus (A) and primary visual cortex (B). Each cross represents an individual transcript. Genes with a log2 fold change >1 or <−1 and adjusted p value <0.05 are coloured green and transcripts of interest are labelled. SYNGO analysis of all significantly changed genes (p adj <0.05) shows that in both STG (C) and VIS (D) substantial numbers of both pre- and post-synaptic transcripts are changed in FTDtau compared to control cases.

