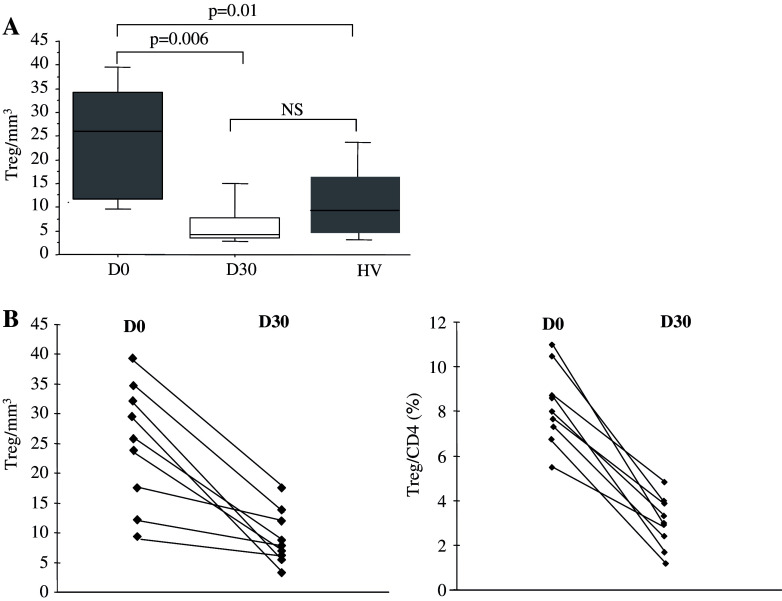
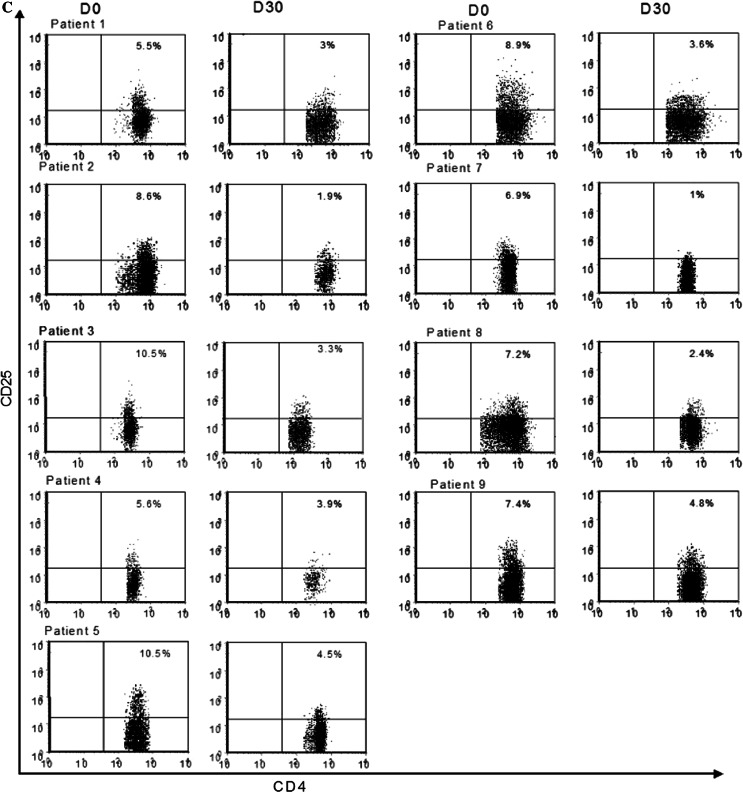
Fig. 1.
Metronomic CTX selectively depletes regulatory T cells (Treg) in cancer patients. a Circulating numbers of CD3+CD4+CD25high per mm3 are determined by FACS analysis. The medians, 75 percentile (box) and SD (whiskers) are depicted for patients (n = 9, Table 1) before (D0) and 1 month after (D30) initiation of metronomic CTX and for healthy volunteers (HV) (n = 15). b Representation of Treg evolution as absolute number (left panel) and percentage of CD4+ T cells (right panel) during metronomic CTX regimen before (D0) and 1 month after (D30) initiation of metronomic CTX for each of the nine treated patients using FACS 3-color staining gating on CD3+CD4+CD25high cells. c Multipanel representation of dot-blot analysis of CD4+CD25high T cells in all patients during metronomic CTX regimen before (D0) and 1 month after (D30) initiation of metronomic CTX for each patients using FACS 3-color staining gating on CD3+CD4+CD25high cells


