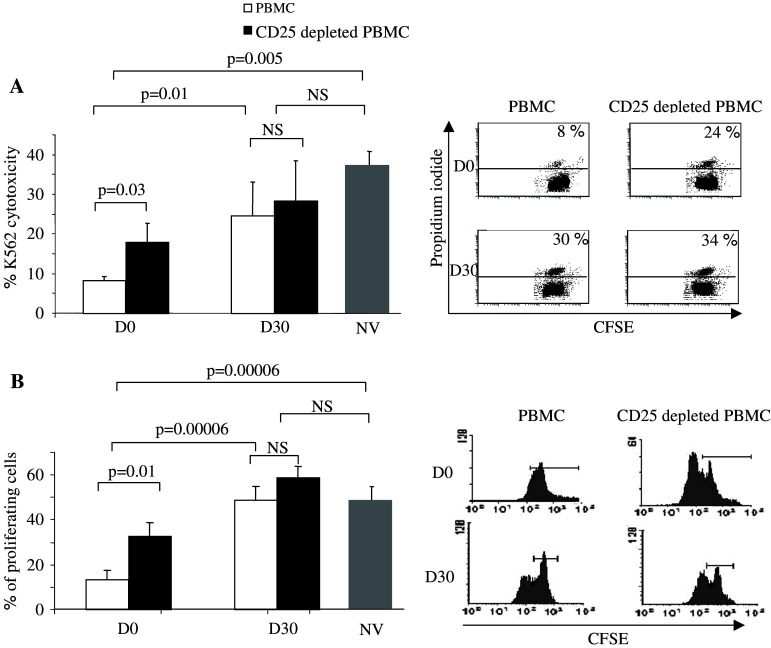
Fig. 4.
T and NK cell functions are enhanced following metronomic CTX treatment in cancer patients. a Killing of K562. Left panel 1 × 10⁵ PBMC depleted or not from CD25+ cells were mixed with 1 × 10⁴ CFSE-labeled K562 cells for 24 h. K562 cell death was assessed by flow cytometry as the percentage of CFSE labeled cells that incorporated propidium iodide. Graphs depict means ± standard deviation of percentages of dead cells for n = 6 patients (Table 1) before (D0) and after (D30) therapy and for n = 5 healthy volunteers. The right panels show detailed dot-plot analyses for a representative patient at D0 and D30 before or after depletion of CD25+ cells. b Proliferation of T cells induced by TCR signaling. Left panel 1 × 10⁵ CFSE-labeled PBMC depleted or not from CD25+ cells were mixed for 72 h with beads coated with anti-CD3 and anti-CD28 mAbs. Proliferation of T cells was determined by flow cytometry as the percentage of CD3+ cells that diluted the CFSE dye. The graph depicts the mean ± standard deviation of percentages for n = 6 patients at D0 and D30 and for n = 5 healthy volunteers. The right panels show detailed CFSE labeling analyses for a representative patient at D0 and D30 before or after depletion of CD25+ cells. Statistical analyses used the Fisher’s exact method (a, b)

