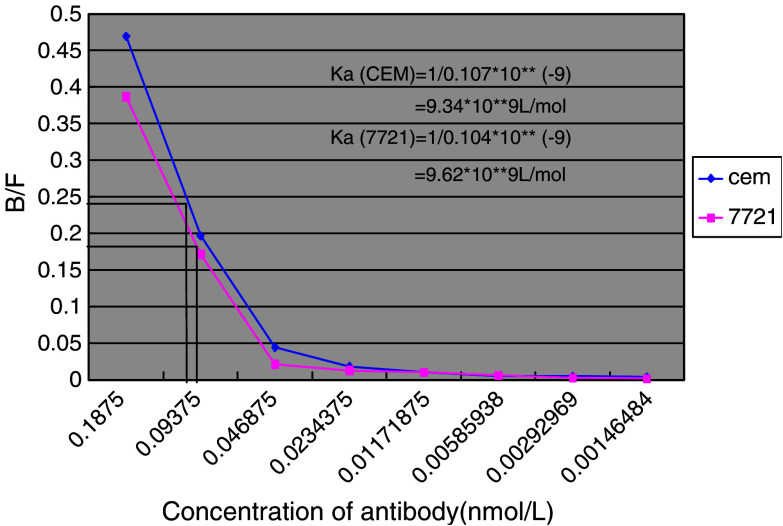
Fig. 1.
The Scatchard plot of D2C affinity constant (Ka). CEM and 7721, using as cell antigen, were cultured under the conditions described in Materials and methods as well as 125I-labeled D2C. The binding rate between antigen and antibody (B/F) is represented on the y-axis, and x-axis displayed the D2C antibody concentration which was double-diluted, the changes of B/F corresponding to D2C concentration were made into the curves. When value of B/F decreased to 50%, Ka of antibody was equal to the reciprocal of corresponding antibody concentration, thus Ka of D2C is calculated to be about 9.34–9.62×10⁹ l/mol by this Scatchard plot

