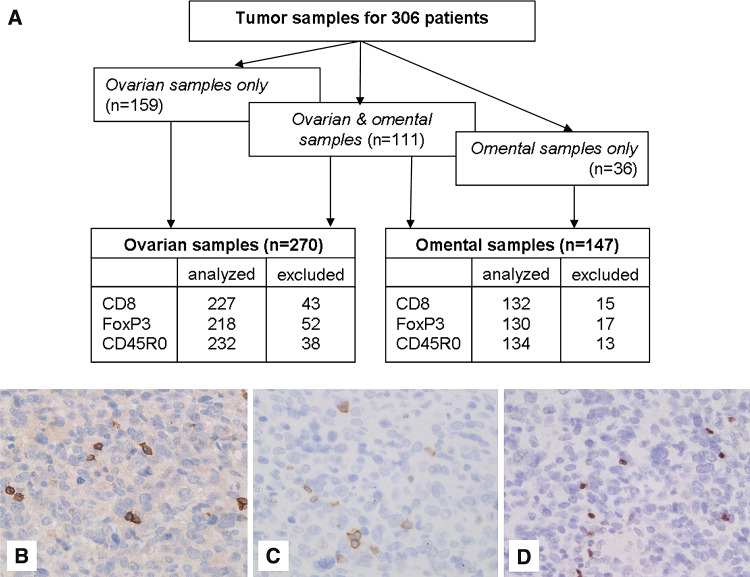
Fig. 1.
Immunohistochemical staining of tumor-infiltrating T-lymphocytes in ovarian cancer tissue. a Flow diagram showing the type of tissue analyzed and the percentage of patients lost from analysis. Patients were excluded from analysis when less than two tissue cores with at least 20% tumor were present for evaluation. b Intra-tumoral CD8+ T-lymphocytes, c CD45R0+ T-lymphocytes, d FoxP3+ T-lymphocytes at 400× magnification

