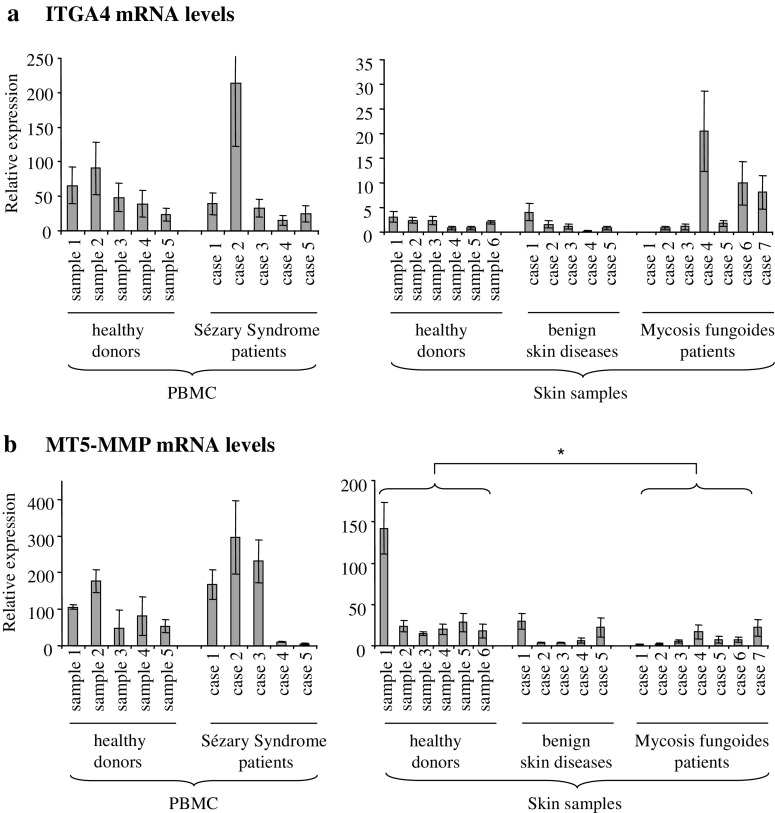
Fig. 3.
Quantification of integrin α4 and MT5-MMP mRNA in CTCL and controls. Samples included PBMC (left graphs) and skin specimens (right graphs) from healthy donors, patients with benign skin diseases, SzS and MF patients. a Integrin α4 transcript levels were higher in PBMCs than in skin samples (note different scale). Specimens of 1/5 SzS and 3/7 MF patients showed clearly elevated integrin α4 mRNA levels, but no significant differences were found between the groups (Mann–Whitney U test). b No difference in expression levels of MT5-MMP mRNA was detected between PBMCs of healthy donors and SzS patients, while specimens of MF patients had slightly decreased amounts in comparison to healthy controls (*p = 0.014)

