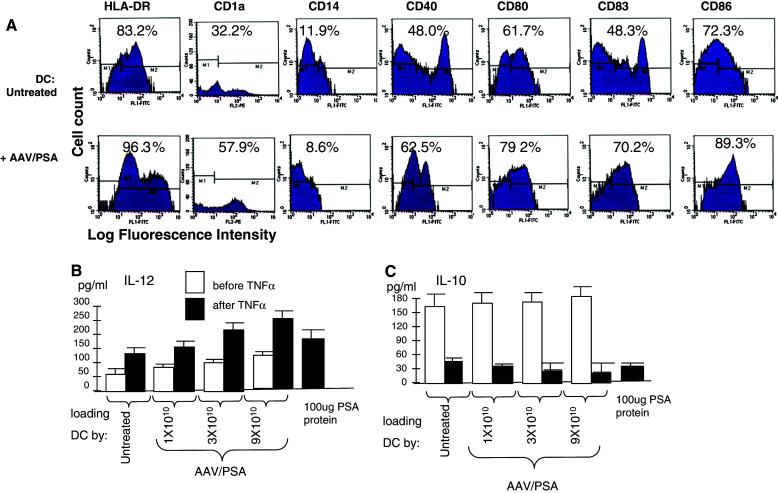
Fig. 5.

a Characterization of DC under different conditions. Monocytes were treated as indicated, treated with GM-CSF, IL-4, and TNFα, and analyzed by FACS for mean fluorescent intensity (MFI) on day 6. Original histograms are shown with percentage of positivity. b and c Secretion of IL-12 (b) and IL-10 (c) by DC. Shown are the levels of secreted IL-12 and IL-10 by DC under various treatments
