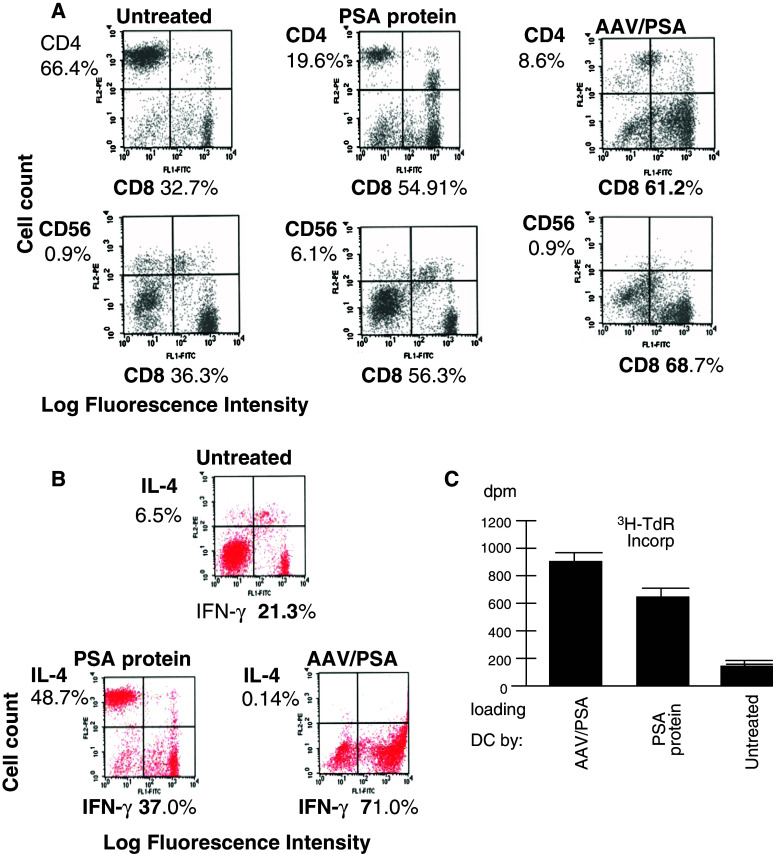
Fig. 6.
a Two-color flow cytometric characterization of surface markers and proliferation of stimulated T cell populations. The top panel shows the CD8 and CD4 prevalence within the activated T cell population resulting from two different pulsing techniques as indicated. The bottom panel shows the CD8 and CD56 prevalence under the same experimental situations as in the top panel. b Two-color flow cytometric characterization of intracellular cytokine expression. Intracellular prevalence of IFNγ and IL-4 within primed T cell populations resulting from untreated-loaded DC (control), PSA protein-loaded, or AAV/PSA-loaded- DC. c T cell proliferation in stimulated T cell populations. The level of proliferation of T cells stimulated by three different treated DC (see Materials and methods section)

