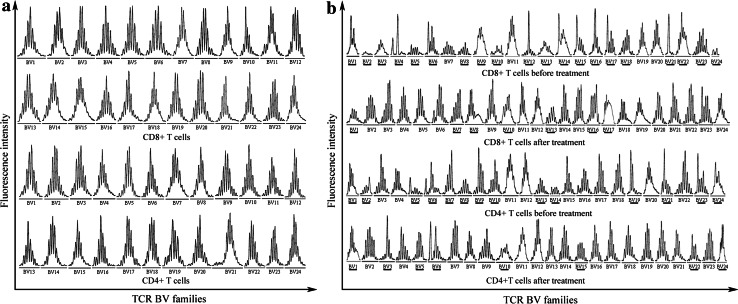
Fig. 2.
CDR3 spectratypes of 24 TCR BV gene families within CD4+ and CD8+ T cells. a Representation of a healthy control, b pre- and post-treatment spectratype profiles of representation of patient treated by mIFL combination of bevacizumab. TCR BV gene families showing evidence of abnormal are underlined

