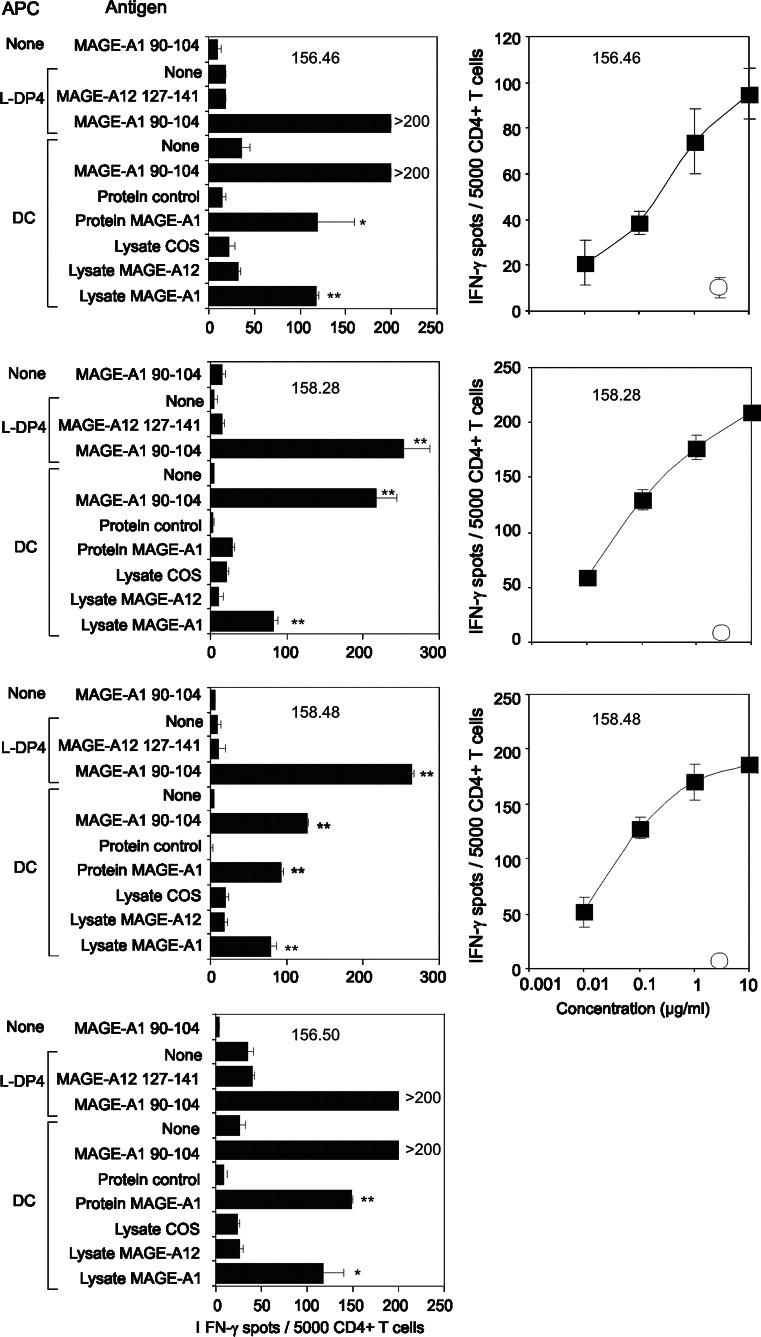
Fig. 1.
Characterization of MAGE-A1 90–104 specific T cell lines. Left panels MAGE-A1 90–104 specific T cell lines (156.46, 158.28, 158.48 and 156.50) were incubated (5 × 10³ cells/well) in an Elispot assay using L-DP4 or immature DC as APC (2 × 10⁴/well). DCs were previously loaded with a lysate of transfected or untransfected COS-7 cells or proteins (1 μM). Right panels T cell lines were incubated in the presence of L-DP4 cells (3 × 10⁴/well) with a concentration range of the peptide (closed squares) or without any peptide (open circle). Each value represents the average spot number of the duplicates. Double asterisk and asterisk indicate P < 0.01 and P < 0.05, respectively

