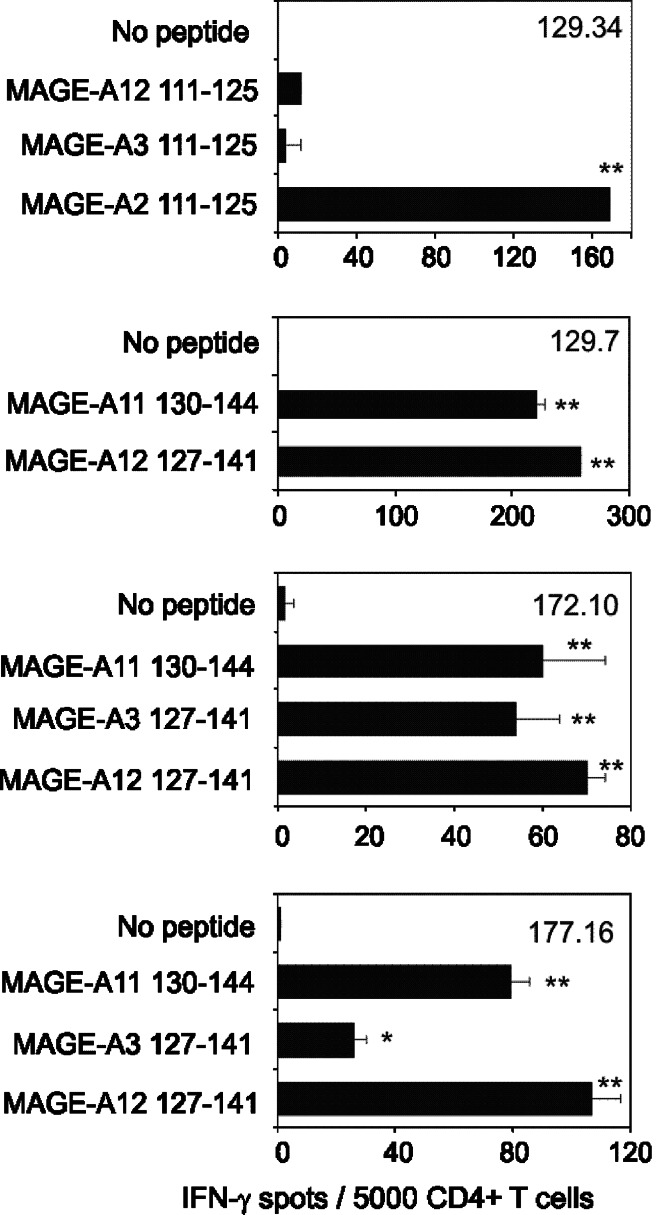
Fig. 4.
Recognition of homologous MAGE peptides by MAGE2 111–125 and MAGE-A12 127–141 T cell lines. T cell lines specific for MAGE-A2 111–125 (129.34) or MAGE-A12 127–141 (129.7, 172.10 and 177.16) were incubated in an Elispot assay using L-DP4 as APC (2 × 10⁴/well). Peptides were added to the culture at a concentration of 10 μg/ml. Each value represents the average spot number of the duplicates. Double asterisk and asterisk indicate P < 0.01 and P < 0.05, respectively

