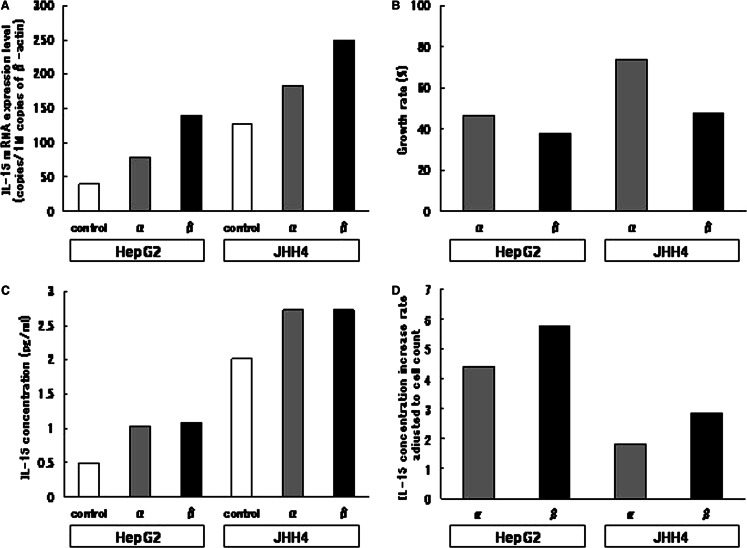
Fig. 3.
The effects of IFN-α and -β on IL-15 expression in HepG2 and JHH4 cells. HepG2 cells and JHH4 cells were cultured with or without 1,000 U/ml IFN-α/β for 72 h. a Expression levels of IL-15 and β-actin gene were quantified by reverse-transcription real-time PCR. The IL-15 mRNA expression level was adjusted to the β-actin mRNA expression level. b Cell numbers were counted by flow cytometry after detachment with trypsinization, and the cell growth rate of IFN-treated cells in comparison with the controls was calculated. c The IL-15 concentration in culture supernatant was quantified by ELISA. d The supernatant IL-15 concentration was adjusted to the cell number, and the IL-15 production increase rate of IFN-treated cells in comparison with the controls was calculated. All experiments were repeated three times and representative results are depicted

