Fig. 5.
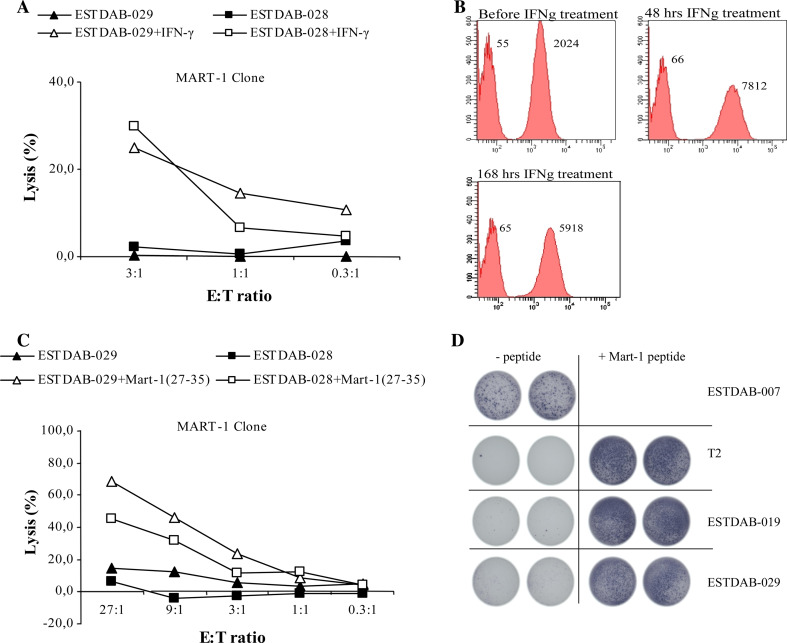
Lysis of human melanoma cell lines treated with IFN-γ, or loaded with peptide on the cell surface by CTL clones. a The melanoma cell lines ESTDAB-028 and 029 were treated with IFN-γ for 48 hours before being used as target cells in the 51Cr-release assay. Effector cells were the MART-127-35-specific CTL clone. The 51Cr-release assays were performed in three E:T ratios. b Histograms show HLA-A2 expression on the surface of the melanoma cell line ESTDAB-029 before, 48 and 168 h of IFN-γ treatment analyzed by FACS. Negative controls are unstained cells (left histograms). Median values are given above the histograms. The magnitude of HLA-A2 expression before or after IFN-γ treatment was determined using the staining index (SI) defined as MFIpositive − MFIbackground/2 × SDbackground where MFI is mean fluorescence intensity. SDbackground is the degree of spread in the negative population (unstained cells) to which the cells stained with HLA-A2 mAb is to be compared. c The melanoma cell lines ESTDAB-028 and 029 were loaded with the MART-127–35 peptide before being used as target cells in c a 51Cr-release assay or d in an ELISPOT assay. The 51Cr-release assays were performed in five E:T ratios, and the ELISPOT were performed in an E:T ratio at 3:1. As shown in the figure was T2 cells and the melanoma cell line ESTDAB-007 included as target cells in the ELISPOT assay

