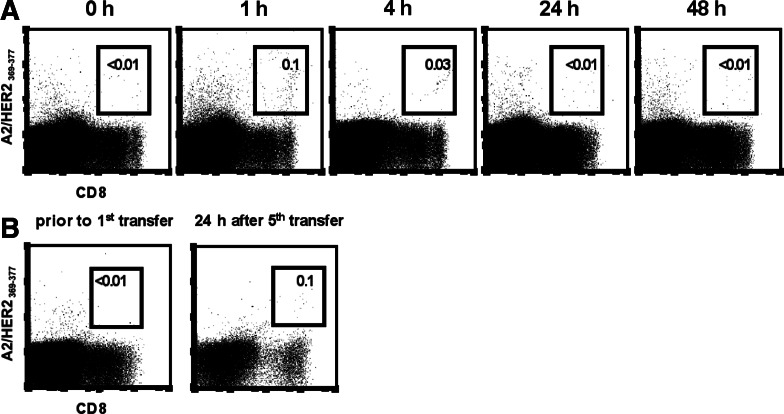
Fig. 3.
Frequency analyses of HER2-specific T cells in the peripheral blood and the BM prior to and after adoptive transfer. a PBMCs of the patient were isolated before and at indicated time points after adoptive T-cell transfer and then stained with A2/HER2369–377 multimers and anti-CD8 antibody in the presence of PI at 4°C. Frequencies of A2/HER2369–377-specific T cells were documented by analyzing 1,782,715 events prior to transfer; 1,051,196 events at 1 h; 811,238 events at 4 h; 1,718,357 events at 24 h; and 1,652,305 events at 48 h after transfer. Indicated frequencies refer to CD8+ T cells. b Frequency of HER2-specific T cells in the BM of the patient was measured prior to the first T-cell transfer and 24 h after the fifth transfer using A2/HER2369–377 multimers. Staining was performed in the presence of anti-CD8 antibody and PI at 4°C. Dot plots are gated on PI-negative cells. The frequencies of A2/HER2369–377-specific T cells were analyzed by counting 889,608 events prior to transfer and 1,961,744 events after the last transfer. Indicated frequencies refer to CD8+ T cells

