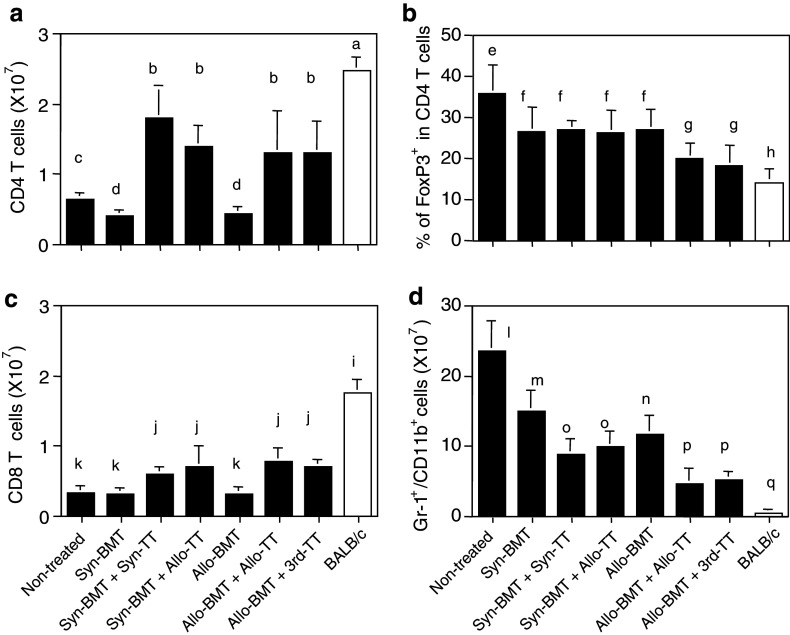
Fig. 4.
The numbers of the cells in spleen from the mice with advanced tumors treated with BMT + TT. The numbers of CD4+ T cells (a), % of FoxP3+ cells in CD4+ T cells (b), the numbers of CD8+ T cells (c) and Gr-1/CD11b cells (d) in the spleen were evaluated in each group. Analyses were performed at the same time as those in Fig. 2. a versus b, c, and d: P < 0.03; b versus c and d: P < 0.02; c versus d: P < 0.02; e versus f, g, and h: P < 0.02; f versus g and h: P < 0.03; g versus h: P < 0.03; i versus j and k: P < 0.02; j versus k: P < 0.03; l versus m, n, o, p and q: P < 0.02; m versus o, p, and q: P < 0.03; n or o versus p and q: P < 0.03; p versus q: P < 0.03. Non-treated (n = 5), Syn-BMT (n = 4), Syn-BMT + Syn-TT (n = 4), Syn-BMT + Allo-TT (n = 4), Allo-BMT (n = 5), Allo-BMT + Allo-TT (n = 4), and Allo-BMT + 3rd-party TT (n = 4). Data are shown as mean ± SD

