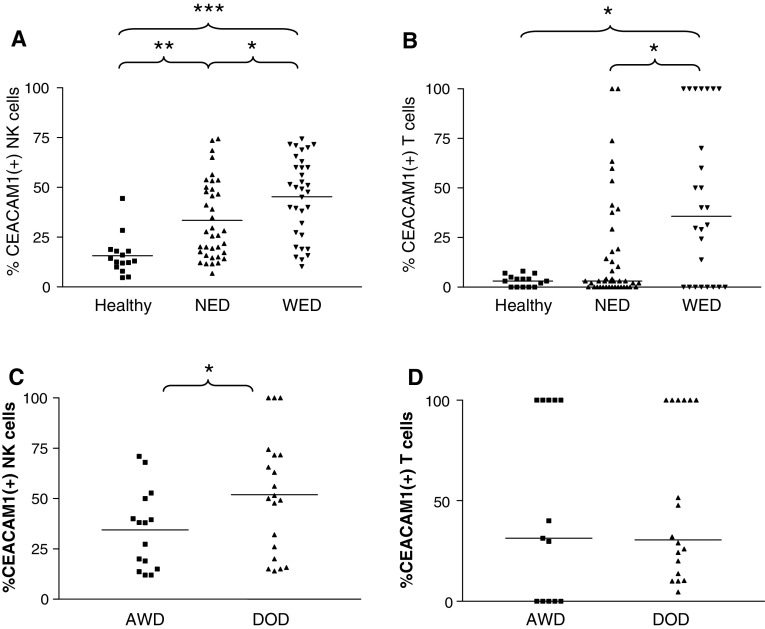
Fig. 6.
Unusually high expression of CEACAM1 on circulating lymphocytes among melanoma patients. This figure shows scatter distribution of CEACAM1 expression profile on circulating NK cells (a) or T cells (b). There are three main groups of samples, healthy donors (filled squares), patients with no evidence of disease (NED, filled upright triangles) and patients with evidence of disease (WED, filled inverse triangles). Each individual shape represents a single sample from the same group. Y-axis denotes the percent of CEACAM1-positive circulating lymphocytes. c, d WED patients were further categorized into patients who died of disease (DOD) during follow-up and patients who remained alive with disease (AWD). This figure shows CEACAM1 scatter distribution on circulating NK cells (c) or T cells (d) in these subgroups. Horizontal lines indicate the median value of the group. Non-parametric two sided t test was used to compare between different groups, as indicated in each plot. *P value <0.05, **P value <0.01 and ***P value <0.001

