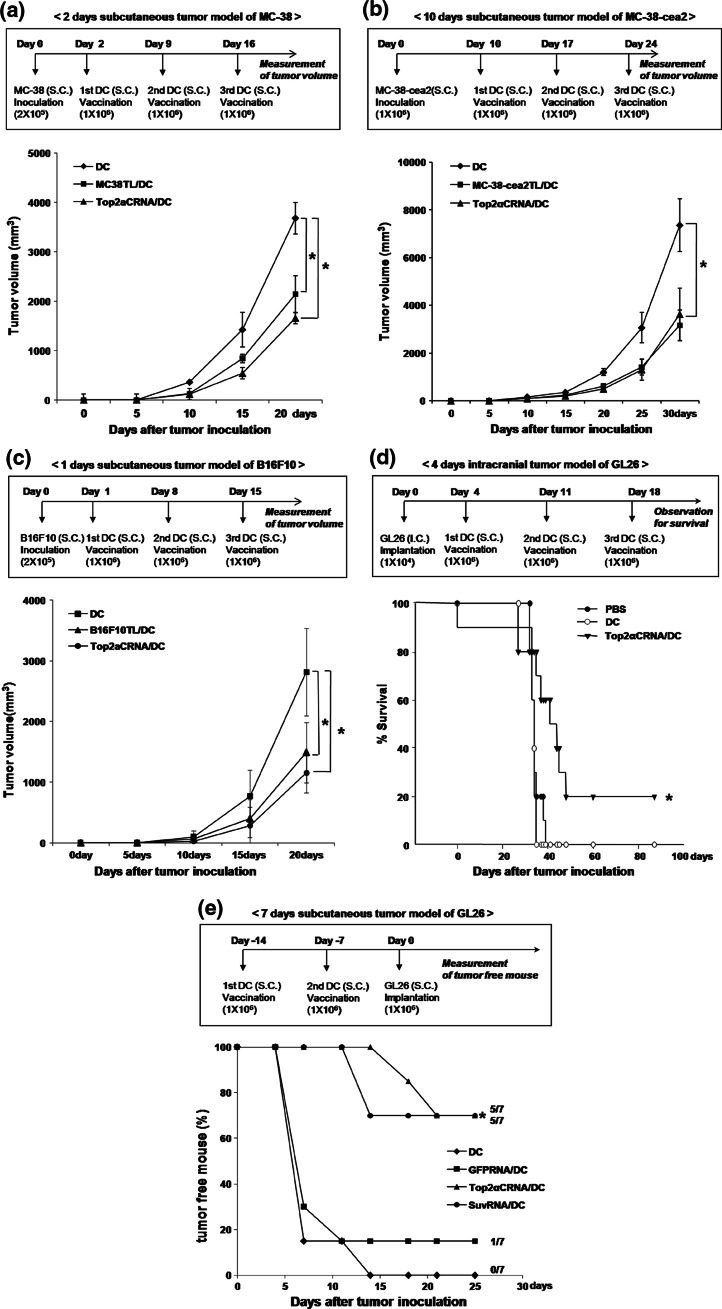
Fig. 5.
Antitumor effects of Top2αCRNA/DC vaccination in murine tumor models. a Tumor growth of mice vaccinated with Top2αCRNA/DC in the MC-38 subcutaneous tumor model. The time schedule for the experiment is shown in the upper panel. The results are given as mean ± SD. The statistical significance was evaluated using a t test. *P < 0.05. The data are representative of three independent experiments, consisting of seven mice per group. b Tumor growth of mice vaccinated with Top2αCRNA/DC in the MC-38-cea2 subcutaneous tumor model. The time schedule for the experiment is shown in the upper panel. The results are given as mean ± SD. The statistical significance was evaluated using a t test. *P < 0.05. Each group consisted of ten mice. c Tumor growth of mice vaccinated with Top2αCRNA/DC in the B16F10 subcutaneous tumor model. The time schedule for the experiment is shown in the upper panel. The results are given as mean ± SD. The statistical significance was evaluated using a t test. *P < 0.05. Each group consisted of eight mice. d Survival by Top2αCRNA/DC in the GL26 intracranial tumor model. The time schedule for the experiment is shown in the upper panel. Survival data were analyzed using the Kaplan–Meier method. The difference between the groups was compared using a log-rank test. *P < 0.05 (DC vs. Top2αCRNA/DC). Each group consisted of five mice. e Tumor free mice after vaccination with Top2αCRNA/DC in the GL26 subcutaneous tumor model. The time schedule for the experiment is shown in the upper panel. The statistical significance was evaluated using a t test. *P < 0.05 (DC vs. Top2αCRNA/DC). Each group consisted of seven mice

