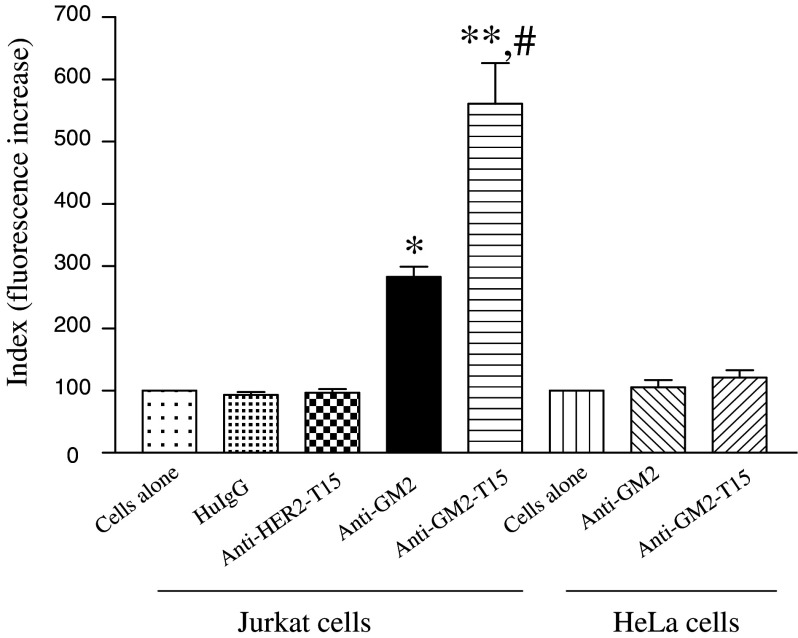
Fig. 4.
Comparison of cell surface binding using FACS analysis with Jurkat (GM2 positive) and HeLa cells (GM2 negative). Calculation of florescence increase is described in the Materials and Methods section. Single asterisk, significant difference compared with cells-alone group, p < 0.05. Double asterisk, significant difference compared with cells-alone group, p < 0.01. Hash, significant difference compared with anti-GM2 group, p < 0.05

