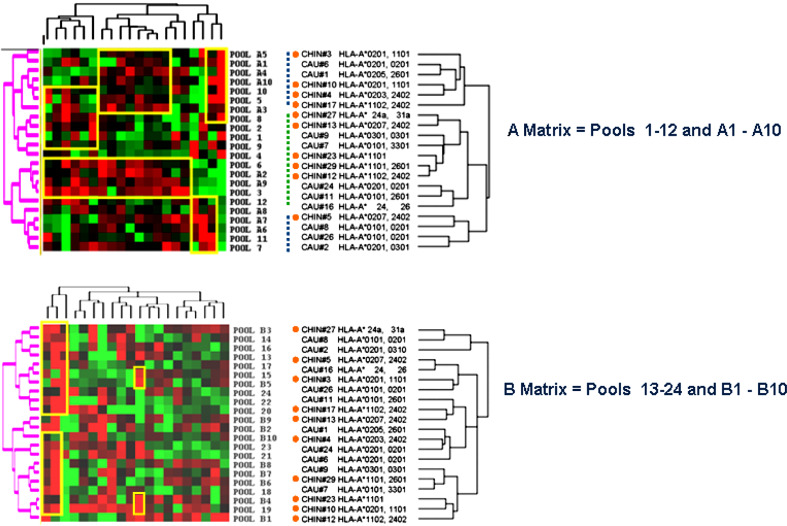
Fig. 1.
Eisen’s clustering analysis of individual peptide pools and PBMC. Normalized (n) log-2 IFN-γ/β-actin ratios are presented according to the central normalization method [83] for the three sub-categories of pool matrixes (A: including pools 1–12 and A1-A10, B: including pools 13–24 and B1–B10). Top panel Matrix A; PBMC from Chinese subjects are underlined by orange circles. Clusters of PBMC predominantly expressing HLA-A2 are outlined by blue dashed vertical bars and the cluster containing PBMC predominantly not expressing HLA-A2 is outlined by a dashed green bar. Bottom panel Matrix B

