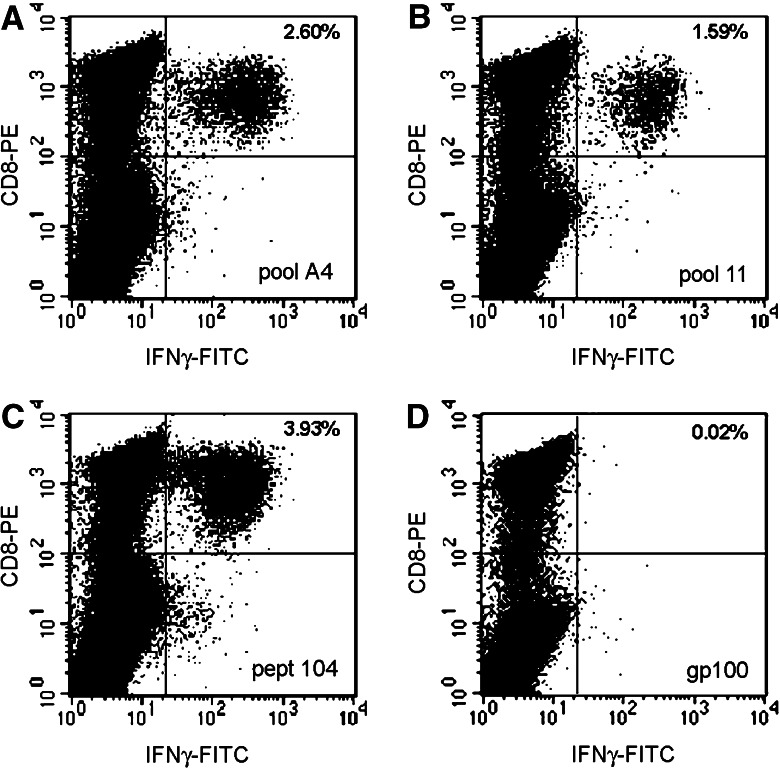
Fig. 3.
Example of epitope validation applying ICS after IVS to increase the frequency of epitopes-specific T cells. PBMC from donor #8 were tested after IVS at day 1 with pool A4 (a). At day 7 the same culture was stimulated with several overlapping pools of which pool 11 tested positive (b). Based on this result, at day 9 the same culture was tested with the corresponding single peptide corresponding according to the two dimensional matrix to LMP2-104 (c). d Negative control (stimulation with gp100:209–217) of the same culture at day 7. In the upper right corner the percent of CD3+CD8+ and IFN-γ+ cells is shown

