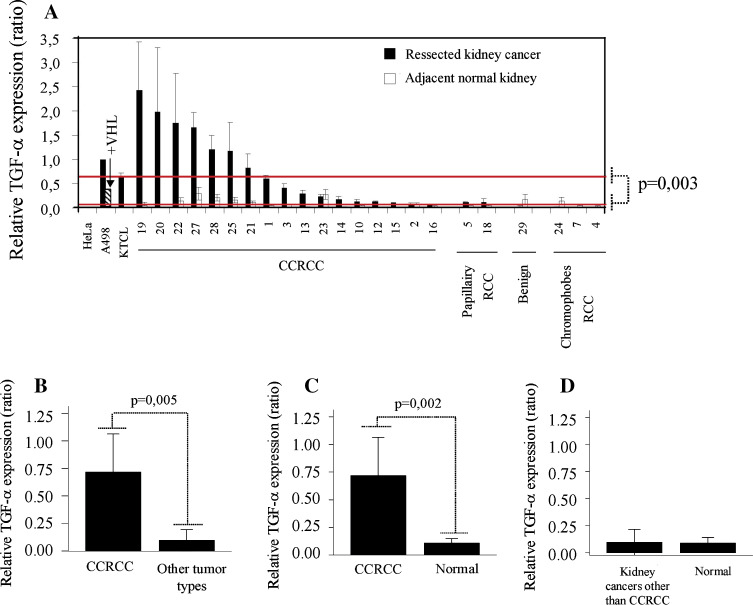
Fig. 1.
TGF-α expression in kidney cancers and adjacent normal tissues. a RNA and cDNA were prepared from resected kidney cancers (black bar) and normal kidney tissues adjacent to the tumor (white bar), and TGF-α expression was evaluated by qRT-PCR (relative to 18S ribosomal RNA). Number corresponds to patient number as listed in Table 1. HeLa cells were used as negative controls whereas the VHL−/−RCC lines: A498 and KTCL140 were used as positive controls. Reintroduction of VHL resulted in decreased TGF-α expression (see hatched bar). Expression levels were compared between CCRCC and other kidney cancer types (b), CCRCC and adjacent normal margins (c), and kidney cancers other than CCRCC and adjacent tissue (d)

