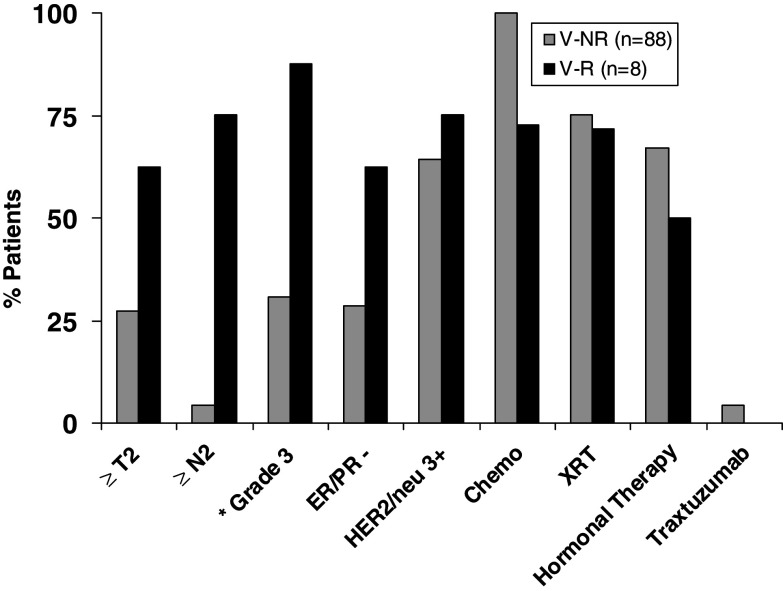
Fig. 3.
Clinicopathological prognostic factors and treatment profiles of all vaccinated patients (n = 96). Vaccinated patients who recurred (V-R) (n = 8) were compared to vaccinated patients who did not recur (V-NR). The asterisk denotes statistically significant differences between V-NR and V-R groups

