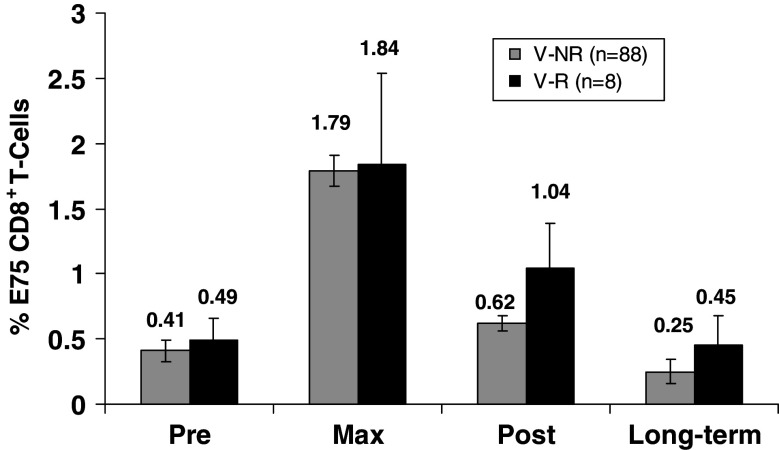
Fig. 4.
All vaccinated patients’ in vitro immune responses during vaccination course. E75-specific CD8+ T cells were measured pre-vaccination (pre), maximum dimer response (max), completion of series (post), and 6 months after last vaccine (long-term), using HLA-A2:Ig dimer assay and results are reported as a percentage of all CD8+ T cells. Results are expressed as mean ± standard errors. There were no statistical differences in the dimer assays during any point between the V-R and V-NR patients

