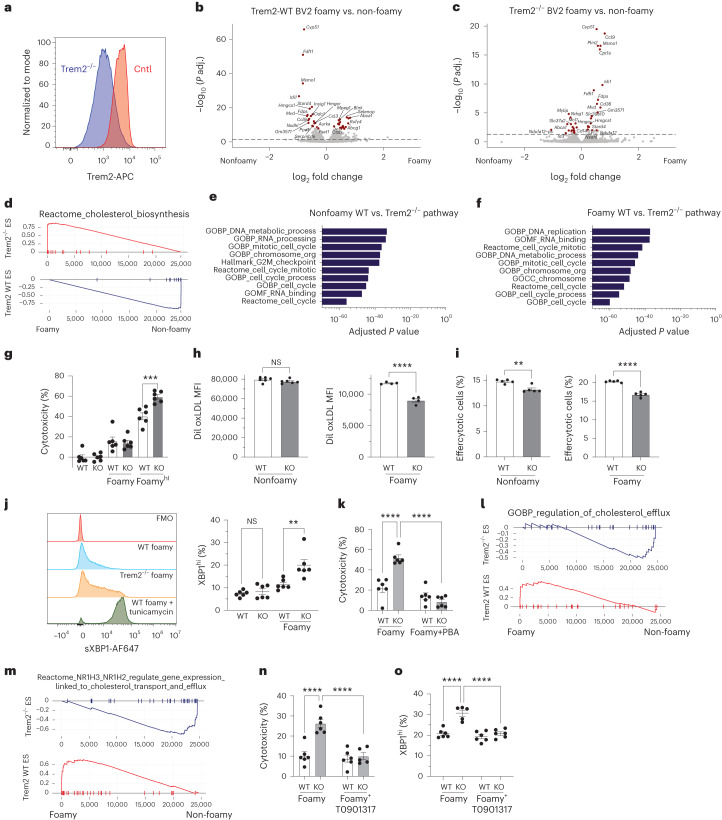
Fig. 8. Trem2-deficient foamy macrophages are susceptible to cell death and enhanced ER stress response through dysfunctional LXR signaling.
a, WT and Trem2−/− BV2s assessed for Trem2 expression by flow cytometry. WT (b) or Trem2−/− (c) BV2 macrophages DEGs from bulk RNA-seq determined by Wald test with DESeq2. d, GSEA plot of cholesterol biosynthesis pathways. ES, enrichment score. e, Pathway analysis of RNA-seq data comparing WT and Trem2−/− non-foamy BV2 cells. f, Pathway analysis of RNA-seq data comparing WT and Trem2−/− foamy BV2 cells. e,f, Significant pathways determined using weighted Kolmogorov–Smirnov test. g, WT or Trem2−/− cell supernatant assessed for cytotoxicity by LDH assay after 16 h (n = 6 biological replicates per group). Foamy: 20 µg ml−1 cholesterol; foamyhi: 80 µg ml−1 cholesterol. Data are mean ± s.e.m. Two-tailed ANOVA, ***P < 0.001. h, DiI-oxLDL uptake for WT or Trem2−/− non-foamy and foamy BV2 macrophages (n = 6 for non-foamy WT and Trem2−/− and n = 4 foamy WT and Trem2−/− biological replicates). Data are mean ± s.e.m. Student’s t-test, ***P < 0.001. i, WT or Trem2−/− non-foamy and foamy BV2 macrophage efferocytosis. Efferocytotic cells were determined by the percent of BV2s that were positive for CTV-labeled splenocytes (n = 5 biological replicates per group). Data are mean ± s.e.m. Student’s t-test, **P < 0.01 and ****P < 0.0001. j, WT or Trem2−/− non-foamy and foamy BV2 macrophage sXBP1 expression. Tunicamycin was used as a positive control (n = 6 biological replicates per group). FMO (fluorescence minus one) shows unstained control. Data are mean ± s.e.m. Two-tailed ANOVA, **P < 0.01. k, WT or Trem2−/− foamy BV2 macrophages (80 µg ml−1 cholesterol) plus 10 µM PBA. Cell supernatant was assessed for cytotoxicity by LDH assay after 16 h (n = 6 biological replicates per group). Data are mean ± s.e.m. Two-tailed ANOVA, ****P < 0.0001. l, GSEA plot of cholesterol efflux pathways from RNA-seq. m, GSEA plot of NR1H2 and NR1H3 gene target pathways from RNA-seq. n, WT or Trem2−/− foamy BV2 macrophages (80 µg ml−1 cholesterol) ± T0901317 percent cytotoxicity (n = 5 biological replicates per group). Data are mean ± s.e.m. Two-tailed ANOVA, ****P < 0.0001. o, WT or Trem2−/− foamy BV2 macrophages (80 µg ml−1 cholesterol) ± 10 µM T0901317, assessed for sXBP1 levels by flow cytometry. Tunicamycin was used as a positive control (n = 5 biological replicates per group). Data are mean ± s.e.m. Two-tailed ANOVA, ****P < 0.0001. KO, knockout; NS, not significant.

