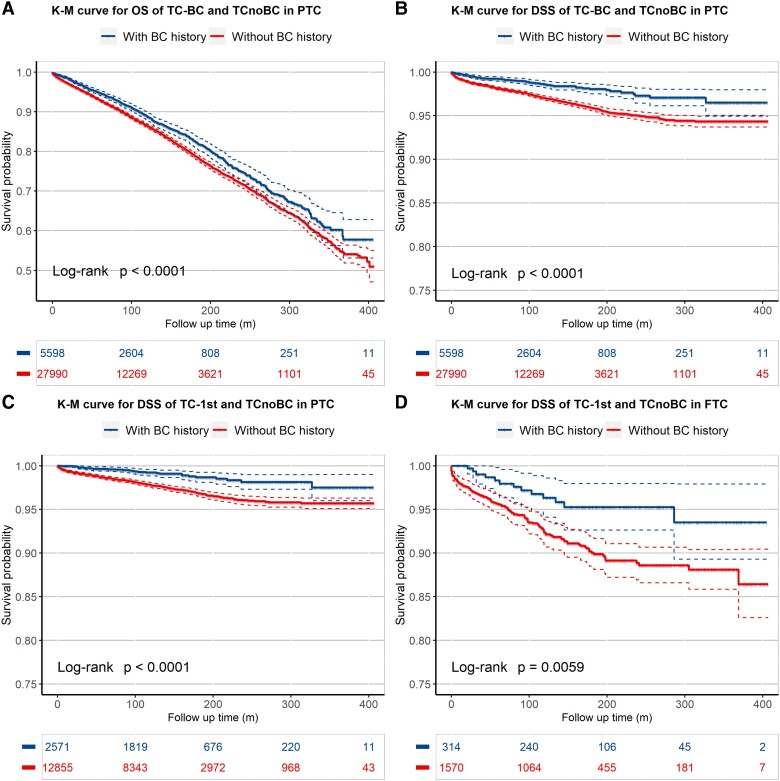
Figure 2.
Kaplan-Meier analysis of the effects of a history of breast cancer (BC) on thyroid cancer (TC)-specific and overall survivals of patients in various settings. The protective effects of a history of BC on the prognosis of TC are revealed in the A, overall survival and B, TC-specific survival of all papillary TC (PTC) patients with a history of BC; C, the TC-specific survival of PTC patients whose TC was diagnosed before BC; and D, the TC-specific survival of follicular TC (FTC) patients whose TC was diagnosed before BC. The blue curve represents TC with a history of BC, and the red curve represents TC without a history of BC. The solid curve represents the survival probability over time in the Kaplan-Meier analysis and the dashed curve represents its 95% CIs.

