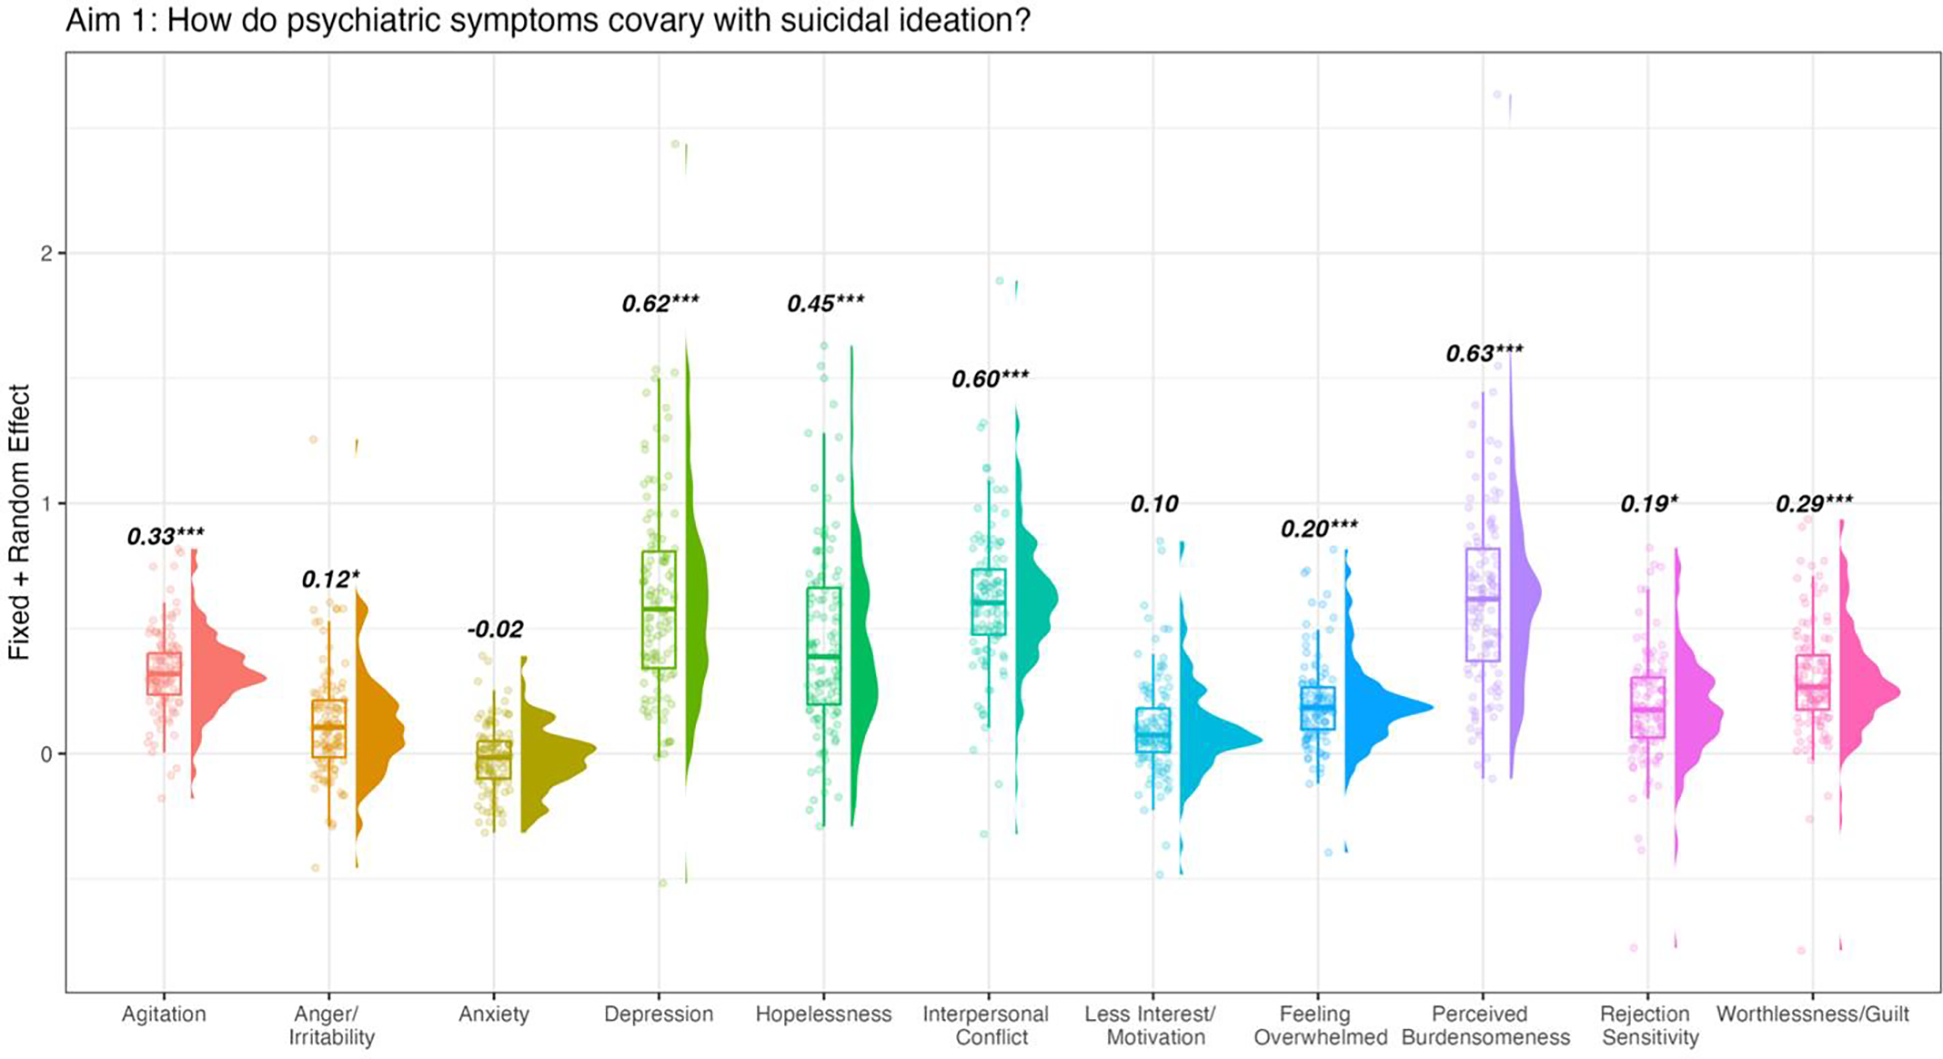
FIGURE 1.

Graphical depiction of fixed and random effect estimates from multilevel models predicting suicidal ideation from each psychiatric symptoma
aHistograms represent the distribution of individual participants. In the box-and-whiskers plot, the box plot defines the interquartile range of the model-implied data, and the whiskers extend to 1.5 times the interquartile range. The mean line within a box plot represents the fixed (average) estimate for the symptom as a predictor of suicidal ideation; the distribution around the fixed effect represents the random effects (i.e., how each person differs from the fixed effect). Zero corresponds to no relationship between the symptom and suicidal ideation. Estimates of fixed effects from each model are indicated above the plot. Random effects were significant (p<0.05) for all models. Asterisks indicate significant fixed-effect contrasts.
*p<0.05. ***p<0.001.
