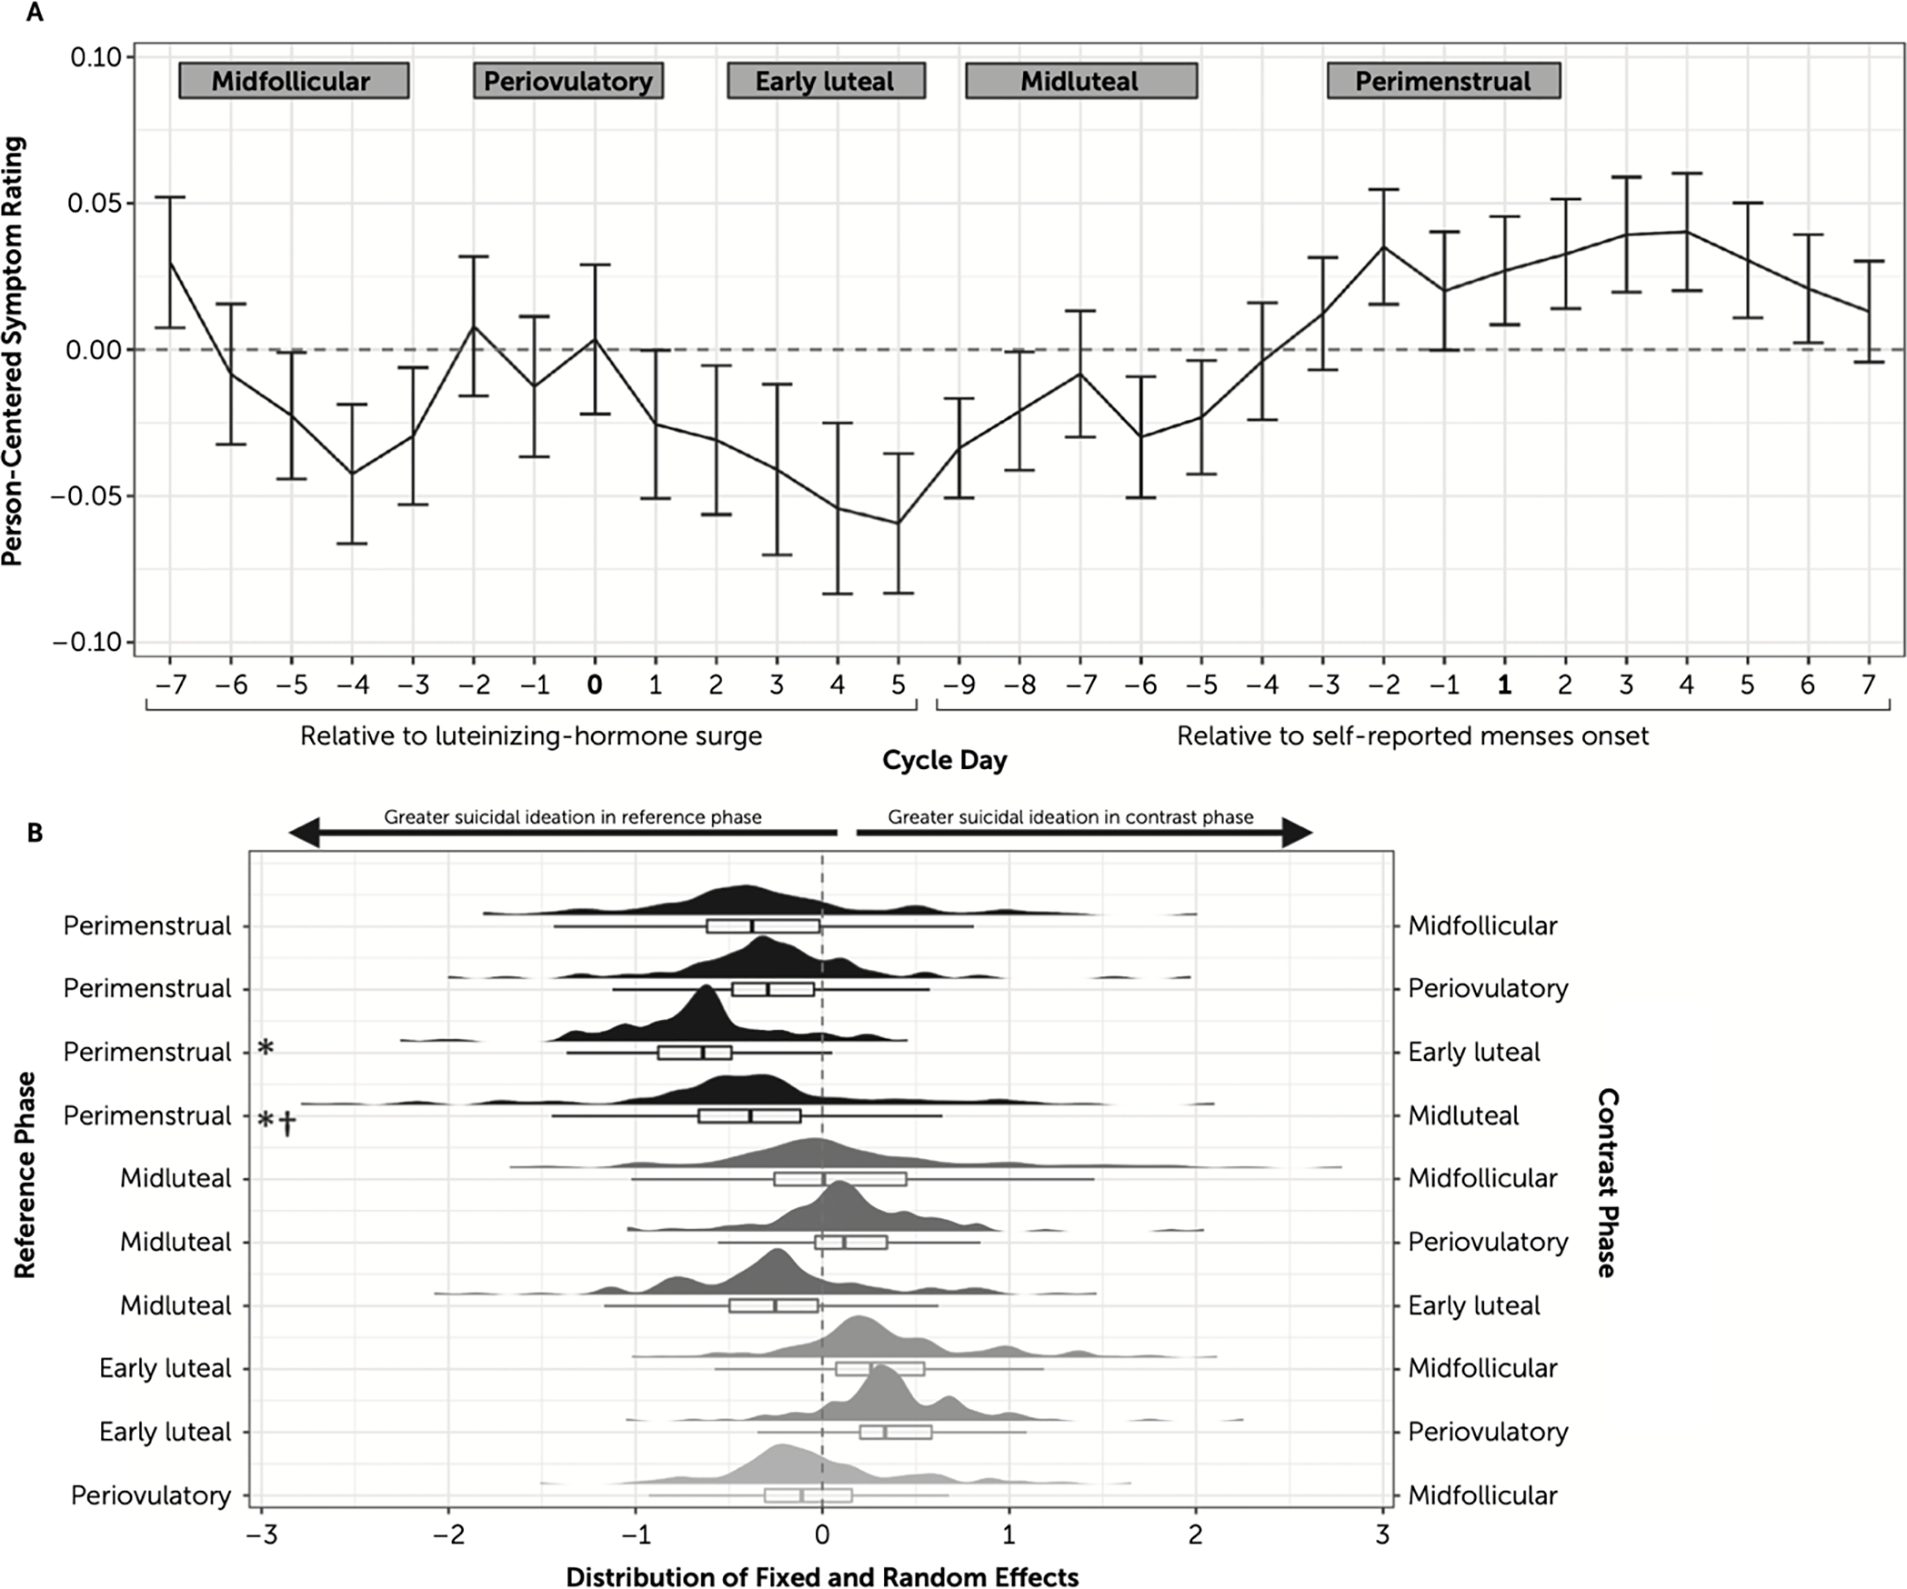
FIGURE 2.

Visualizations of symptom trajectories across the cycle and random effect distributions for suicidal ideationa
aPanel A shows person-centered suicidal ideation across the cycle, calculated as a 3-day rolling average per person (error bars represent standard error of the mean). Zero represents no difference from each participant’s person-centered mean symptom level. Across the x-axis, “L” indicates day in relation to the surge in luteinizing hormone, “M” indicates day in relation to menses onset, and dots indicate the day of the luteinizing hormone surge and the day of menses onset. Cycle phases are indicated with gray rectangles spanning the cycle days that comprise each phase. Panel B is a graphical depiction of fixed and random estimates from multilevel models predicting suicidal ideation from the cycle phase. Histograms represent distributions of individual participants. In the box-and-whiskers plot, the box plot defines the interquartile range of the model-implied data, and the whiskers extend to 1.5 times the interquartile range. The mean line within a box plot represents the fixed (average) estimate of the cycle contrast as a predictor of suicidal ideation; the distribution around the fixed effect represents the random effects (i.e., how each person differs from the fixed effect). Zero corresponds to no relationship between that cycle-phase contrast and suicidal ideation. E. Lut=early luteal phase; Midfol=midfollicular phase; Midlut=midluteal phase; Perimens=perimenstrual phase; Periov=periovulatory phase. In panel B, asterisks indicate a significant fixed effect, and the cross indicates a significant random effect.
