
Figure 3:
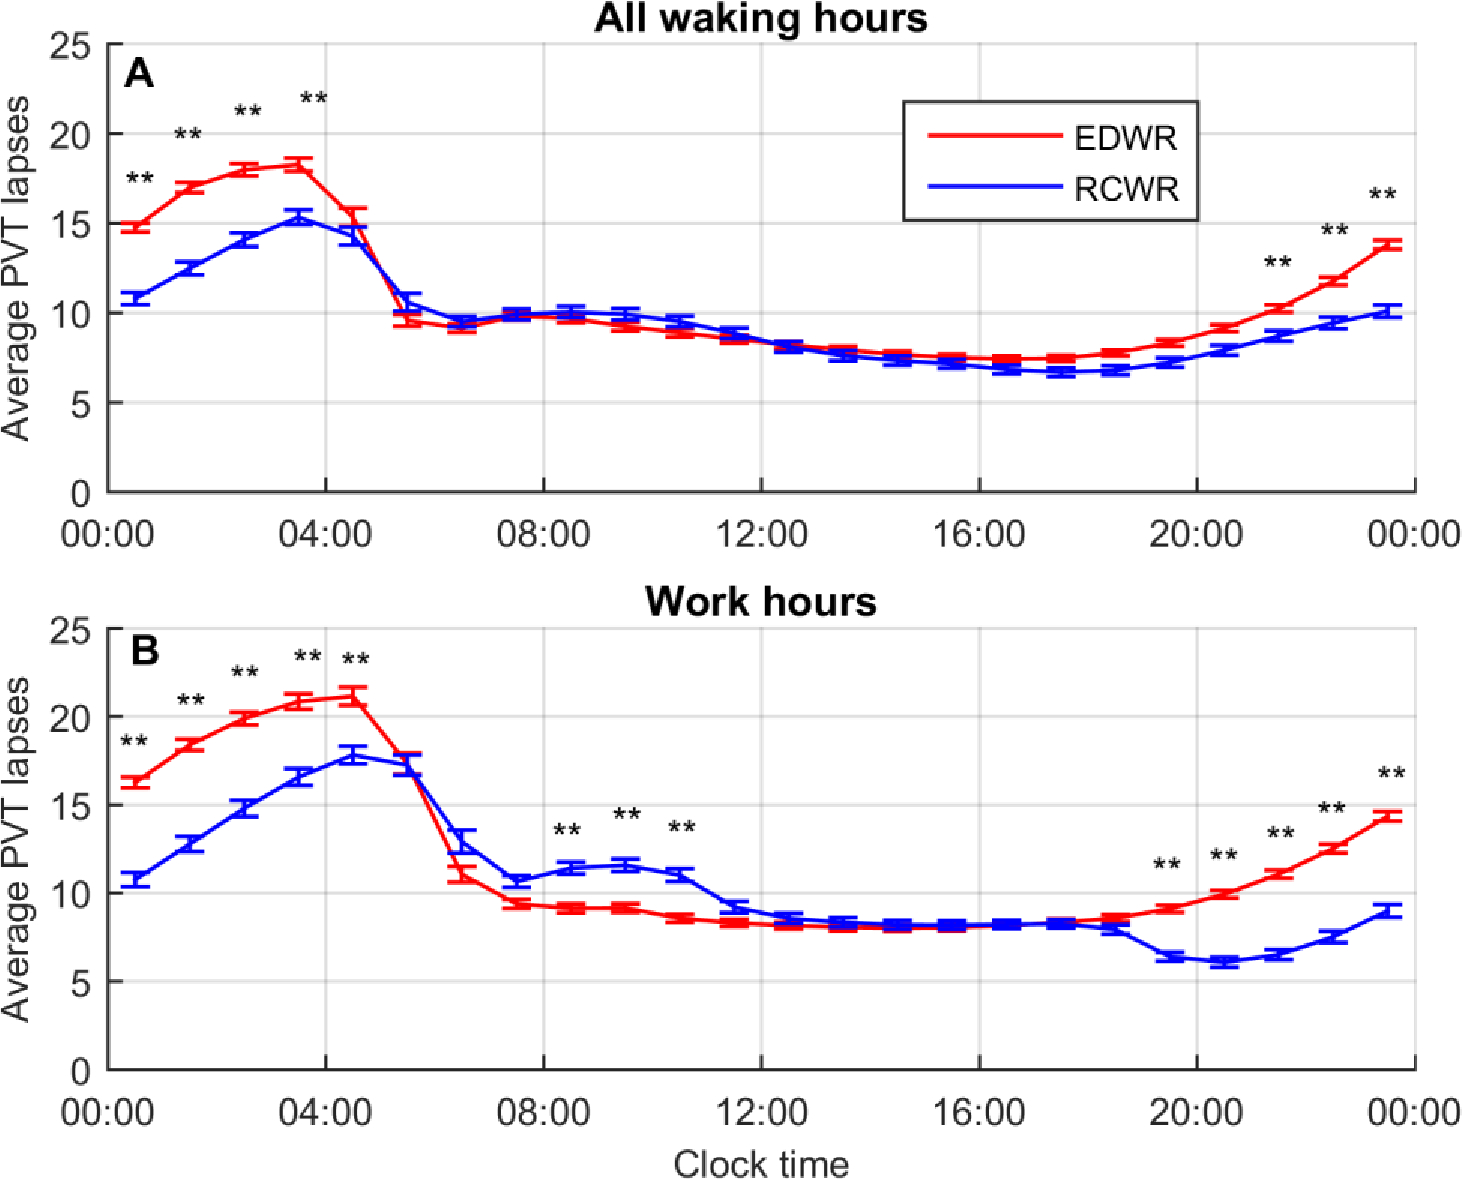
Mean predicted attentional failures as measured by PVT lapses for Extended Duration Work Roster (EDWR) and Rapidly Cycling Work Roster (RCWR) schedule conditions, plotted by time of day averaged across all data sets (169 schedules total; 95 EDWRs and 74 RCWRs) in 1-hour clock time bins. Data are plotted for (A) all hours of wakefulness, and (B) working hours, and plotted at the midpoint of each clock hour. Error bars show mean ± SEM. Significance is shown for timepoint-wise comparisons: *p<0.002, **p<0.0001.