


Figure 2.
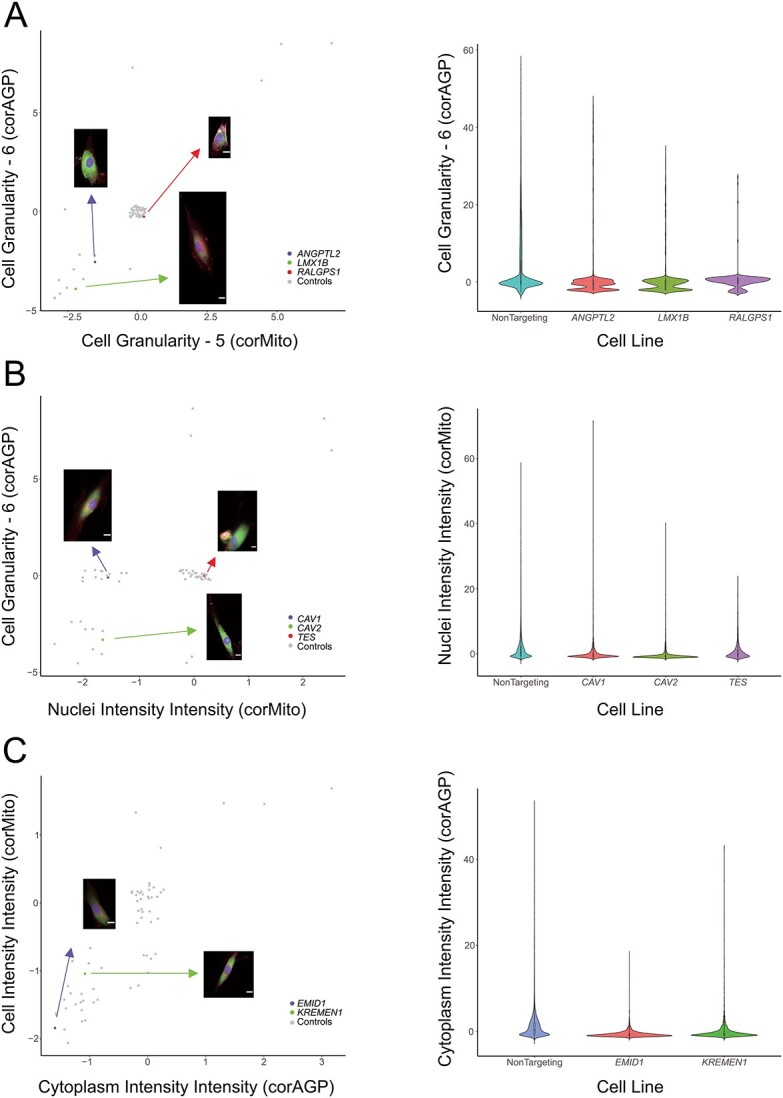
Morphological features of selected genes at multi-gene loci. (A) ANGPTL2, LMX1B, and RALGPS1; (B) CAV1, CAV2, and TES; (C) EMID1, and KREMEN1. Scatter plots of the mean value of each group of features with representative images (jitter was applied to avoid overplotting)(scale bar: 5 μm). Alt-text: Profiles for selected morphological features of genes from multi-gene loci.