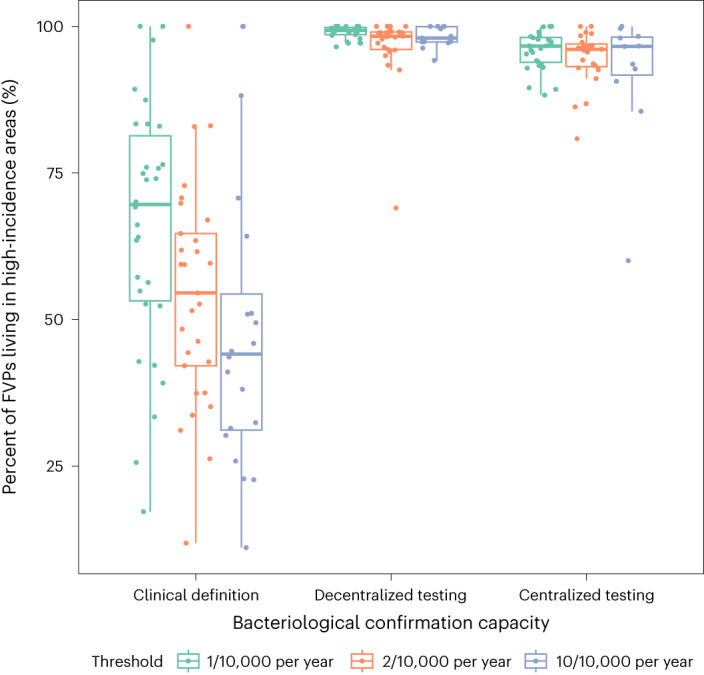
Fig. 3. Percent of FVPs living in high-incidence-rate administrative units by country.

For each modeling scenario, each point represents the country median of percent of FVP living in administrative units with a true incidence rate exceeding the incidence rate threshold indicated by the color. The boxplot represents the distribution of country-level medians (n = 35 countries), where the box demarcates the 25th, 50th and 75th percentile and the whiskers extend beyond the 25th and 75th percentiles by 1.5 times the interquartile range.
