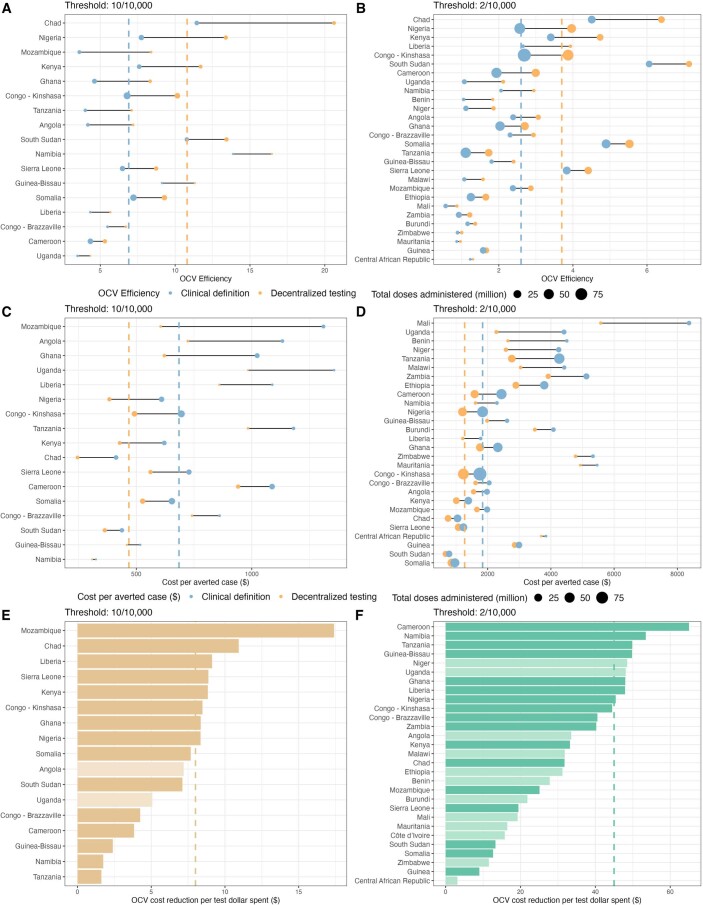
Extended Data Fig. 4. Total doses administered, total cost per averted cases, and OCV cost reduction per test dollar spent compared between clinical definition testing and decentralized testing scenarios by country.
Country-level OCV efficiency for the clinical definition and decentralized testing settings are depicted for the (A) 10 per 10,000 and (B) 2 per 10,000 incidence rate thresholds. Country-level costs per averted case for the clinical definition and decentralized testing settings are depicted for the (C) 10 per 10,000 and (D) 2 per 10,000 incidence rate thresholds. For panels (A)-(D), clinical definition results are in blue, decentralized testing results are in goldenrod, and point sizes refer to the total doses administered in a given scenario (in millions). Country-level OCV cost reductions per test dollar spent are depicted for the (E) 10 per 10,000 and (F) 2 per 10,000 incidence rate thresholds. For all panels, the vertical dashed lines represent the cross-continent median estimate for a given setting (matched by color). A baseline incidence rate for each country was calculated by taking the mean of the population-weighted gridded 2010-2016 mean annual suspected cholera incidence rate across 1000 posterior samples1. For panels (E) and (F), countries with a 2010-2016 mean annual incidence rate greater than or equal to the median of the country baseline incidence rates (9.1*10−5 per year) had dark-shaded bars while countries below the median had light-shaded bars.

