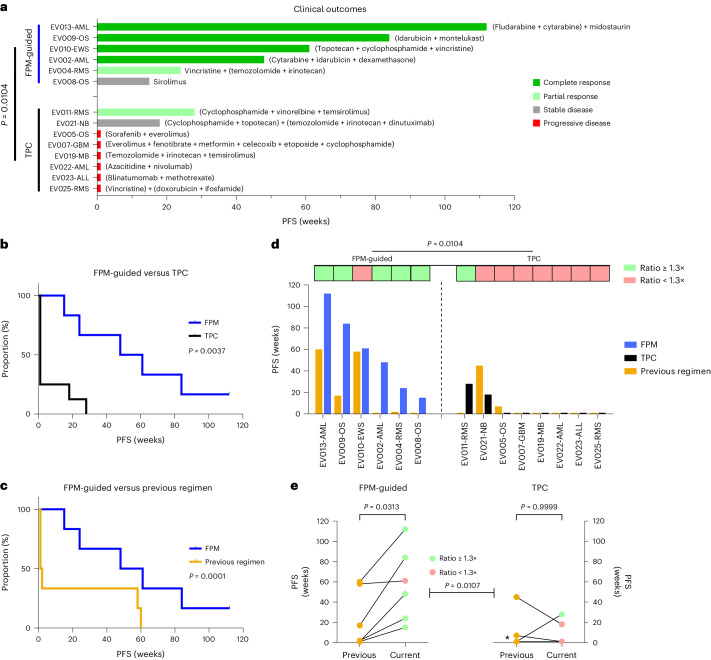
Fig. 4. FPM-guided therapies provide significant clinical benefit in patients with refractory or relapsed pediatric cancer.
a, Swimmer plot illustrating patient best objective response and PFS to treatments assigned following FPMTB review, grouped by FPM-guided and TPC-treated patients. Agents beside each patient represent treatments given during the study. P value determined by two-sided Barnard’s test. b, Comparison of PFS in the TPC-treated and FPM-guided cohorts. P value determined by logrank test analysis of Kaplan–Meier survival data. c, Comparison between the PFS of the trial regimen and the PFS of the patient’s previous regimen in the FPM-guided cohort. P value is from two-sided Cox proportional hazards test of paired survival data. d, Comparison of PFS from the previous regimen (orange in bar graph) and trial regimens for both FPM-guided (blue in bar graph) and TPC (black in bar graph) cohorts, with indications for patients with a PFS ratio of ≥1.3× (light green boxes above indicated patients) and <1.3× (light red boxes above indicated patients). P value determined by two-sided Barnard’s test analysis of occurrences of PFS ratio of ≥1.3×. e, Difference in PFS of the previous regimens and trial regimens for FPM-guided (left) and TPC-treated (right) cohorts. Asterisk, five patients who received TPC and had the same previous and trial regimen PFS. P values for each cohort determined by two-sided paired Wilcoxon test. P value between cohort determined by two-sided Mann–Whitney U-test of PFS ratio values. Light green dots indicate patients with a PFS ratio of ≥1.3× (top), light red dots indicate patients with a PFS ratio of <1.3×, and orange dots indicate the PFS of the previous regimen for both cohorts.

