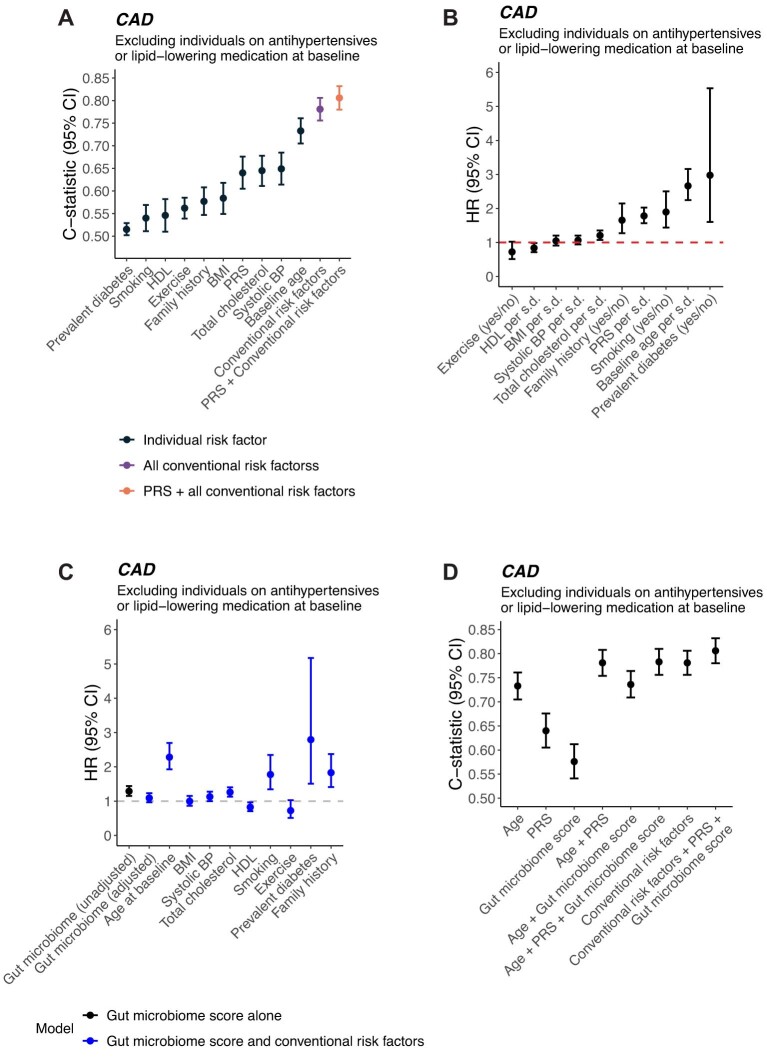
Extended Data Fig. 2. Sub-analysis of incident CAD in individuals who were not on antihypertensives and lipid-lowering medications at baseline (n = 4,293).
In sex-stratified Cox models of PRS and conventional risk factors, (a) C-statistics and (b) hazard ratios (HRs) are depicted alongside their 95% confidence intervals (CIs) as dots and error bars. In sex-stratified Cox models of the gut microbiome score and conventional risk factors, (c) HRs of the gut microbiome score and conventional risk factors are depicted alongside their 95% CIs as dots and error bars. (d) In Cox models for integrative analysis, C-statistics and their 95% CIs of are presented as dots and error bars.

