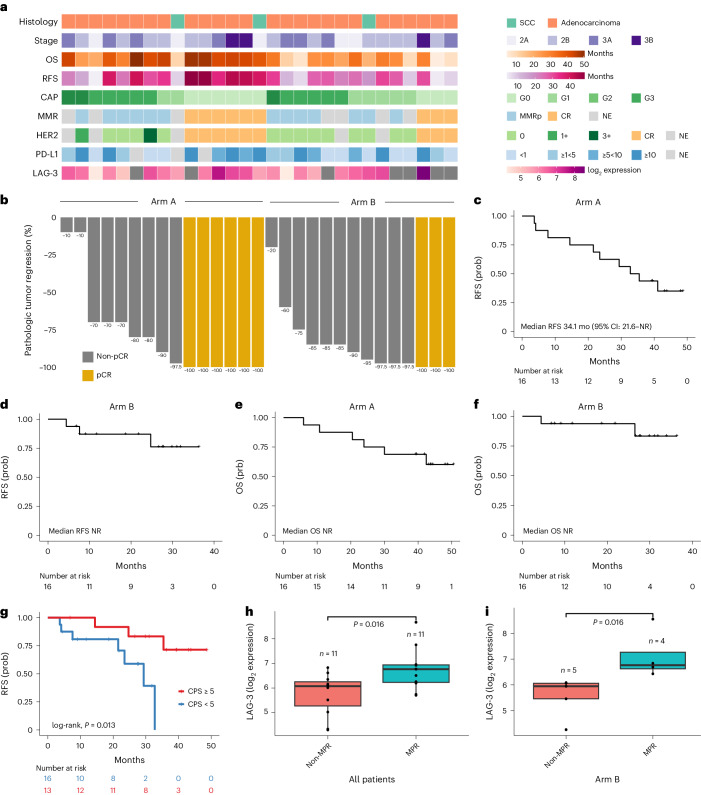
Fig. 2. Clinical outcomes, pathological response and biomarker expression.
a, Select clinical and pathological features for each patient that underwent resection after neoadjuvant nivolumab + CRT (Arm A; n = 15) and nivolumab + relatlimab + CRT (Arm B; n = 14). b, Waterfall plot of pathological tumor regression (computed as % viable tumor − 100%) for each patient. c, Kaplan–Meier curve of probability of RFS in all patients treated in Arm A (n = 16). d, Kaplan–Meier curve of probability of RFS in all patients treated in Arm B (n = 16). e, Kaplan–Meier curve of the probability of OS in all patients treated in Arm A (n = 16). f, Kaplan–Meier curve of the probability of OS in all patients treated in Arm B (n = 16). g, Kaplan–Meier curve of probability of RFS in patients based on baseline tumor PD-L1 CPS; patients with a CPS ≥5 at baseline (n = 16) had a longer RFS compared to patients with a CPS <5 (n = 13; median RFS not reached versus 29.34 months for CPS ≥5 and <5, respectively; log-rank, P = 0.013). h, Patients who attained an MPR (n = 11) had a higher LAG-3 expression at baseline compared to patients with a non-MPR (n = 11; median LAG-3 expression 6.68 versus 6.01, respectively, two-sided Wilcoxon rank-sum test, P = 0.016). i, These findings were driven by Arm B, as patients who attained an MPR (n = 4) had a higher baseline LAG-3 expression (median LAG-3 expression 6.77 versus 5.95, respectively, two-sided Wilcoxon rank-sum test, P = 0.016). All box plots depict the median value, with the lower and upper hinge corresponding to the first and third quartiles, respectively. The upper whisker extends from the upper hinge to at most 1.5× interquartile range and the lower whisker extends from the lower hinge to at most 1.5× interquartile range. MMRp, mismatch repair proficiency. Prob, probability.

