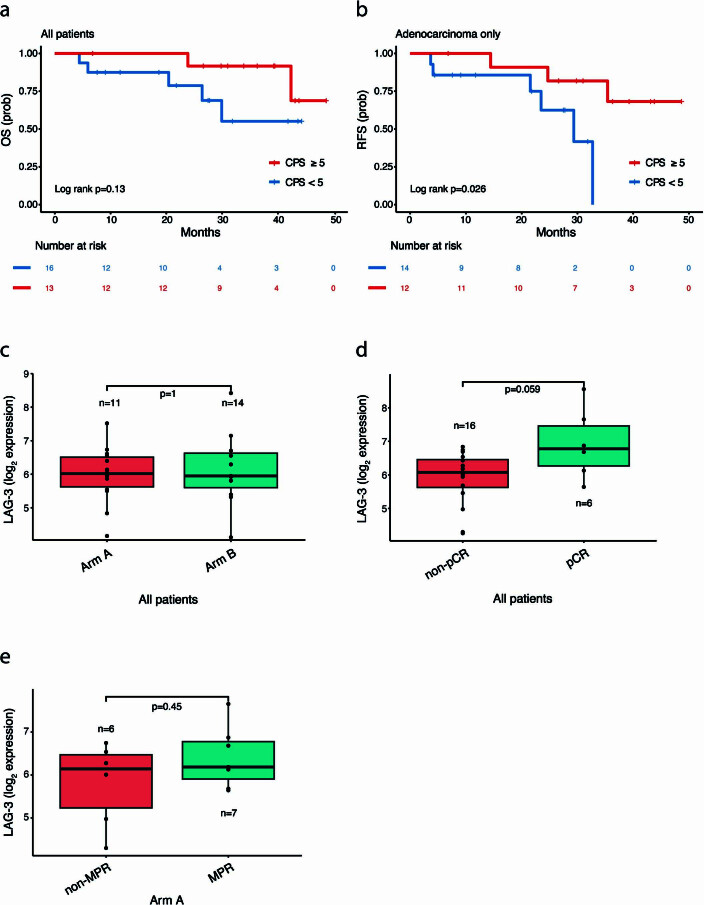
Extended Data Fig. 3. Clinical outcomes of patients with differential baseline PD-L1 and LAG-3 expression.
(a) A trend toward a longer OS was noted for patients with a baseline PD-L1 CPS ≥5 compared to patients with a CPS <5 (log-rank p = 0.13). (b) When considering patients with adenocarcinoma (n = 26), patients with a baseline PD-L1 CPS ≥5 had a longer RFS compared to patients with a CPS <5 (median RFS not reached vs 29.34 months, respectively, log-rank p = 0.026). (c) There was no difference in normalized LAG-3 expression in baseline tumors by treatment arm (median LAG-3 normalized log2 expression of 6.12 vs 6.09 for arms A and B, respectively, two-sided Wilcoxon rank-sum test, p = 1). (d) Patients who attained a pCR showed a trend toward a higher baseline LAG-3 expression compared to patients who did not attain a pCR (median LAG-3 expression 6.78 vs 6.08, respectively, two-sided Wilcoxon rank-sum test, p = 0.059). (e) When considering Arm A patients (n = 13), there was no difference in baseline LAG-3 expression based on MPR status (median LAG-3 expression 6.14 vs 6.19 for non-MPR and MPR, respectively, two-sided Wilcoxon rank-sum test, p = 0.45). All box plots depict the median value, with the lower and upper hinge corresponding to the first and third quartiles, respectively. The upper whisker extends from the upper hinge to at most 1.5× the interquartile range and the lower whisker extends from the lower hinge to at most 1.5× the interquartile range.

