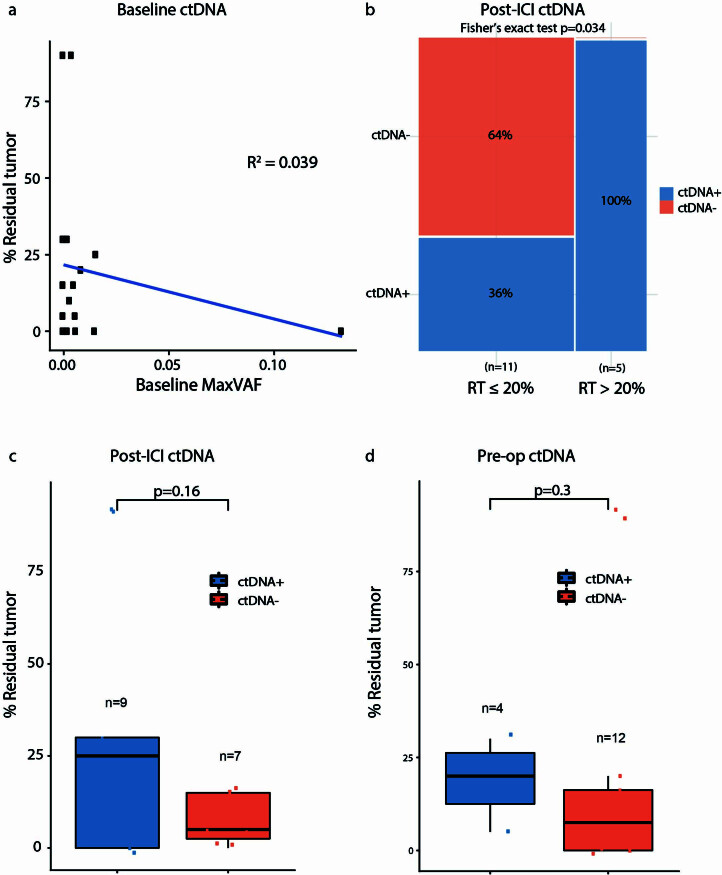
Extended Data Fig. 4. Correlation between ctDNA status at different time points and residual tumor volume at the time of surgery.
(a) The level of ctDNA at baseline, represented by the maximal mutant allele frequency of tumor-derived variants, did not correlate with the percent of residual tumors at the time of resection (Pearson’s correlation coefficient R2 = 0.039). (b) Detectable ctDNA post-ICI induction was associated with >20% residual tumor (two-sided Fisher’s exact, p = 0.034). (c) Patients with undetectable ctDNA post-ICI (orange) showed a trend toward a lower residual tumor volume at the time of resection compared to patients with detectable ctDNA at that time point (blue; median residual tumor 5% vs 25%, respectively, two-sided Wilcoxon rank-sum test, p = 0.16). (d) Patients with undetectable ctDNA at the preop time point had a numerically lower residual tumor volume at the time of resection when compared to patients with detectable ctDNA at the same time point; however, this did not reach statistical significance (median residual tumor 7.5% vs 20%, respectively, two-sided Wilcoxon rank-sum test, p = 0.3). All box plots depict the median value, with the lower and upper hinge corresponding to the first and third quartiles, respectively. The upper whisker extends from the upper hinge to at most 1.5× the interquartile range and the lower whisker extends from the lower hinge to at most 1.5× the interquartile range.

