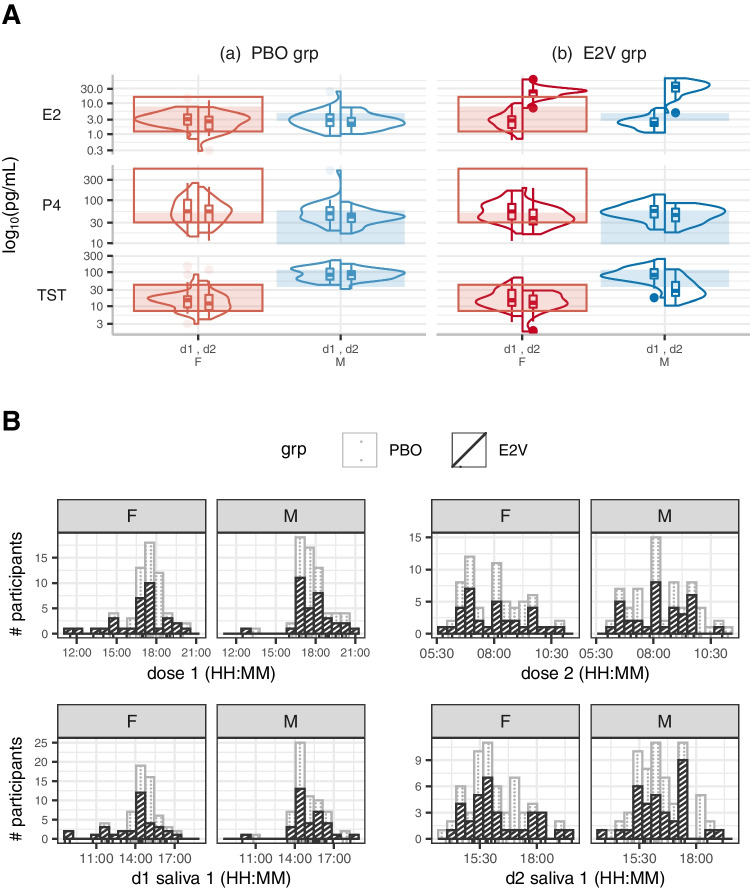
Fig. 1.
Hormone levels with times of testing across groups. A (top) Distributions of hormone levels measured in saliva of 17-estradiol (E2), progesterone (P4) and testosterone (TST) are shown for men (M) and women (F) in the placebo- (PBO) and estradiol-administered (E2V) groups prior to administration on day 1 (d1) and after treatment on day 2 (d2). Shaded areas are the expected concentrations for the age range (and follicular phase for the women) of our participants, as published by the manufacturer of the hormone assays used. The box outlines delimit the expected physiological range across the entire menstrual cycle for the age range of our female participants. Daily E2V administration of 8 mg for women and 12 mg for men over two consecutive days increased E2 concentrations in both men and women and decreased TST concentrations in men. B (bottom) Stacked bar charts and rug charts, by treatment group, showing number of participants cumulative across groups (# participants) who received doses and had saliva collected at the time specified (HH:mm, 24-h clock). To avoid diurnal fluctuations in hormone levels, participants were tested in the afternoon as close to the same times as was practical. They received the first dose (dose 1) of E2V (dark, cross-hatched bars) or PBO (light, dotted bars) capsules in the afternoon on day 1 and took the second dose (dose 2) the following morning. Hormone levels were measured from saliva samples collected several times over an hour to ensure stable assessment. Shown here are the times on a 24-h clock of the first sample collected on each day. On day 1 (d1), saliva was sampled before the first dose to test baseline hormone concentrations. On day 2 (d2), about 8 hours following the second dose, i.e., late afternoon, participants completed the Y-maze, arena, and town tasks. The first task was started about an hour before the first saliva sample was collected (the times shown in the bottom right panel)

