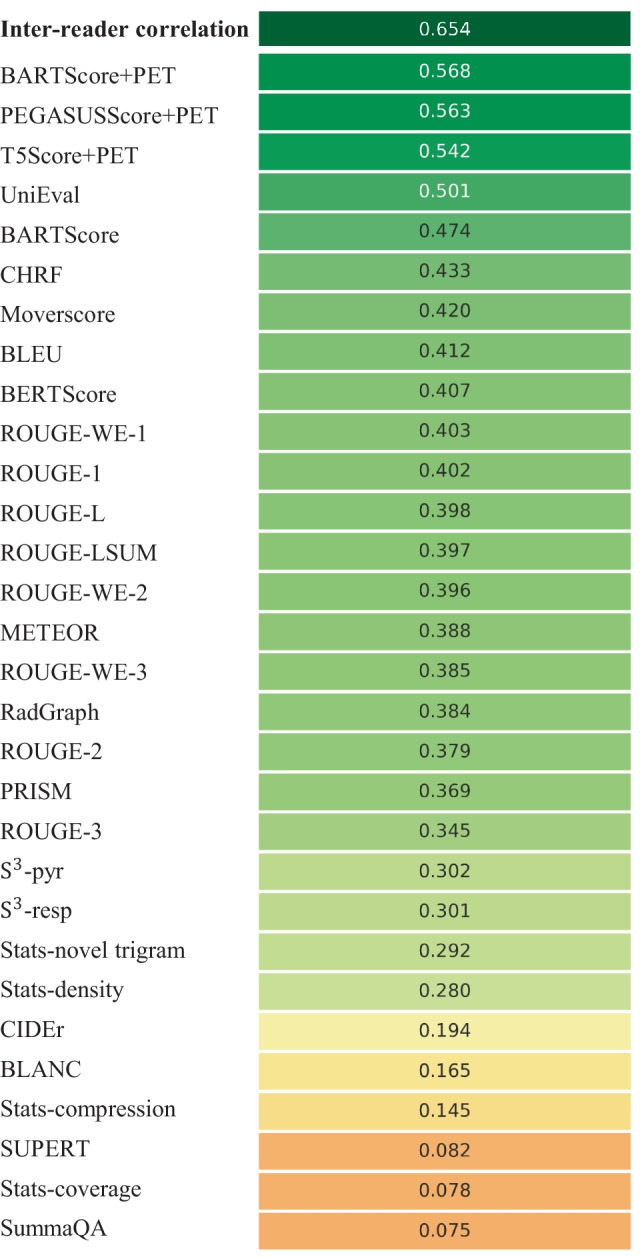
Fig. 2.

Spearman’s ρ correlations between different evaluation metrics and quality scores assigned by the first physician. The top row quantifies the inter-reader correlation. Notably, domain-adapted BARTScore (BARTScore + PET) and PEGASUSScore (PEGASUSScore + PET) demonstrate the highest correlations with physician preferences
