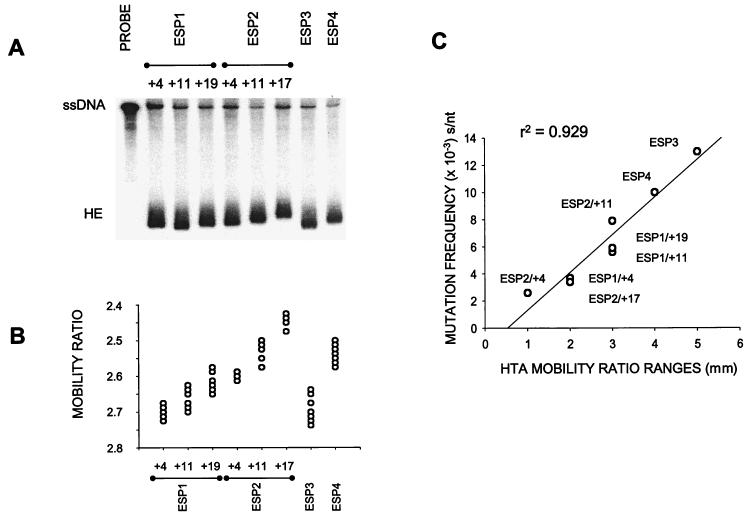
FIG. 4.
HTA of eight HIV-1 group O samples from Spain. A 1,680-bp fragment corresponding to full-length encoding RT sequences was analyzed by HTA. (A) A comparison of quasispecies diversity in eight average sequences (Table 1) using HTA. PCR-amplified pol gene products from samples were hybridized to the probe, a PCR-amplified 32P-labeled clone, separated on a nondenaturing polyacrylamide gel, and then autoradiographed as described in Materials and Methods. Samples corresponding to those described in Table 1 are indicated above each lane. The lane labeled PROBE contains only PCR-amplified, radiolabeled probe DNA in the heteroduplex reaction. ssDNA and HE designate the single-stranded probe DNA and heteroduplexes, respectively. (B) Mobility ratios calculated by dividing the migration distance of each heteroduplex band by the migration distance of the single-stranded probe were plotted for each HTA performed on the 10 clones of each sample. The distribution of dots represents the relative heterogeneity of quasispecies in each sample. (C) Comparison between the heterogeneity of quasispecies inferred by HTA for each sample and those calculated by sequencing the corresponding set of clones. Mobility ratio ranges (in millimeters) of the heteroduplexes from each group of 10 clones were plotted against the point mutation frequency (in substitutions per nucleotide). Frequencies were obtained by sequencing a 267-bp fragment, RT codons 28 to 116, from each individual genomic clone of the corresponding group (see Fig. 5) and were calculated as described in footnote b of Table 2. A coefficient of regression was obtained (r2 = 0.929), with a 99% degree of confidence.

